Consumer Corner
Buffalo thunders back as Zillow’s hottest market for 2025
Affordability and job growth are key drivers of competition
- Competition among buyers never cooled in Buffalo last year, and that heat should keep smoldering through 2025.
- Hot markets spread from the Northeast, Great Lakes and South regions into the Midwest and West.
- Virginia Beach jumped farthest up the list from 2024, leapfrogging over 23 markets.
SEATTLE, Jan. 7, 2025 /PRNewswire/ — Buffalo, New York, will be the hottest major housing market in 2025, according to a new analysis by Zillow®, the first time a market has held the title in back-to-back years. Relative affordability and few homes for sale are common threads among what should be the most competitive markets for buyers this year. 
“Construction that keeps pace with an area’s growth remains a crucial piece of keeping homes available and accessible. In chilly Buffalo, competition among buyers will remain hot, with employment growing far faster than builders are adding homes,” said Skylar Olsen, Zillow chief economist. “Shoppers nationwide should see more options for sale than in recent years, along with slow and steady price growth. That’s the good news. But both buyers and sellers should expect unpredictable mortgage rates.”
This hotness ranking of the nation’s 50 most populous metros takes into account Zillow’s forecast for local home value growth and how quickly homes are selling. It also considers job growth per new home permitted and expected growth in owner-occupied households.
Zillow forecast Buffalo to be the hottest market in 2024, and that prediction proved prescient. Sellers held a strong advantage in negotiations there throughout last year, according to Zillow’s market heat index.
Buffalo has the most new jobs per new home permitted — a measure of expected demand. New jobs often mean new residents, which raises competition and drives up prices unless builders can match the additional demand.
Although affordability has improved slightly compared to last year, it’s still top of mind for buyers. Lower-than-average home prices and rent costs in Buffalo as well as Midwest metros like Indianapolis, St. Louis and Kansas City have bolstered demand in these areas, helping push them to the top of the list.
Relative affordability is a powerful force, too. Nearby alternatives to expensive Northeastern metros like New York and Boston dominated Zillow’s list of the most popular cities among home shoppers in 2024. Metropolitan areas in the same vein — Providence, Hartford and Philadelphia — rank high on this list as well.
Hartford, Providence, Indianapolis and Charlotte are all among the top five in Zillow’s forecast for home value appreciation in 2025. Hartford leads the pack with 4.2% expected growth. But home value growth is set to largely level out this year — even these standout metros look tame compared to the double-digit annual appreciation seen in 2021 and 2022.
Rising fastest in the ranks from 2024’s hottest markets list is Virginia Beach, which leapfrogged over 23 markets to the No. 13 spot this year, driven by job growth that has far outpaced new home permitting. Memphis fell the farthest by the same token, dropping 30 places, as new home permitting has eclipsed low job growth.
After the entire western half of the country was shut out of last year’s top 10, Salt Lake City nudged its way onto this year’s list at No. 10. San Diego was the only other Western metro in the top 20, at No. 19.
Mortgage rates are likely to continue on their bumpy path in 2025, and swings will have a major impact on which homes shoppers can afford or even qualify for. Zillow Home Loans’ BuyAbilitySM tool tracks rates in real time to show users which homes fit their budget.
| 2025 Hottest Markets Rank | Metropolitan Area | Change in Rank from 2024 | Zillow Home Value Index (ZHVI) 2024 | ZHVI Year over Year Growth, 2024 | 2025 Home Value Growth Forecast | Jobs per New Home Permitted | Change in Inventory Versus 2018–2019 Averages |
| 1 | Buffalo, NY | 0 | $260,537 | 5.7 % | 2.8 % | 2.0 | -46.1 % |
| 2 | Indianapolis, IN | 2 | $275,639 | 3.6 % | 3.4 % | 0.5 | -16.1 % |
| 3 | Providence, RI | 2 | $484,019 | 6.7 % | 3.7 % | 1.3 | -62 % |
| 4 | Hartford, CT | 15 | $363,298 | 6.5 % | 4.2 % | 1.1 | -68.6 % |
| 5 | Philadelphia, PA | 6 | $362,744 | 4.6 % | 2.6 % | 1.5 | -46 % |
| 6 | St. Louis, MO | 9 | $250,141 | 4.2 % | 1.9 % | 1.3 | -43.8 % |
| 7 | Charlotte, NC | 0 | $377,450 | 1.6 % | 3.2 % | -0.5 | 17.5 % |
| 8 | Kansas City, MO | 10 | $299,118 | 3.8 % | 2.7 % | 0.2 | -36 % |
| 9 | Richmond, VA | 11 | $368,957 | 4.1 % | 2.9 % | -0.1 | -43.3 % |
| 10 | Salt Lake City, UT | 18 | $543,324 | 2.8 % | 2.3 % | 0.5 | -4.8 % |
| 11 | Cincinnati, OH | -9 | $281,887 | 4.6 % | 2.9 % | -0.2 | -32.8 % |
| 12 | Columbus, OH | -9 | $310,746 | 3.8 % | 3.1 % | -0.8 | -20.5 % |
| 13 | Virginia Beach, VA | 23 | $349,186 | 4.6 % | 2.5 % | 1.2 | -42.6 % |
| 14 | Cleveland, OH | -6 | $228,140 | 6.4 % | 2.8 % | 0.6 | -52.6 % |
| 15 | Miami, FL | 10 | $486,056 | 1.0 % | 3.5 % | 1.0 | -4.4 % |
| 16 | Boston, MA | 10 | $694,494 | 4.7 % | 2.1 % | 0.1 | -45.8 % |
| 17 | Oklahoma City, OK | 21 | $230,466 | 2.5 % | 2.4 % | 0.7 | -2.5 % |
| 18 | Detroit, MI | 6 | $248,126 | 4.8 % | 1.7 % | 0.1 | -34.1 % |
| 19 | San Diego, CA | 10 | $939,174 | 3.8 % | 2.5 % | -0.4 | -32.9 % |
| 20 | Birmingham, AL | 21 | $247,509 | 0.7 % | 1.3 % | 0.4 | -13.9 % |
| 21 | Raleigh, NC | -4 | $441,066 | 1.1 % | 1.7 % | -0.7 | -13.5 % |
| 22 | Riverside, CA | 12 | $583,420 | 3 % | 2.4 % | -0.3 | -25. % |
| 23 | Orlando, FL | -14 | $391,924 | -0.3 % | 2.2 % | -0.6 | 17 % |
| 24 | Atlanta, GA | -18 | $379,262 | 0.3 % | 2.6 % | -0.7 | -3 % |
| 25 | Pittsburgh, PA | -9 | $208,583 | 2.8 % | 0.6 % | 1.0 | -32.3 % |
| 26 | Louisville, KY | -12 | $255,206 | 4.7 % | 1.9 % | -0.4 | -27.1 % |
| 27 | Phoenix, AZ | 8 | $454,001 | -0.3 % | 1.7 % | -0.4 | -7.9 % |
| 28 | Washington, DC | 11 | $567,825 | 4.4 % | 0.8 % | -0.1 | -38.8 % |
| 29 | Tampa, FL | -19 | $372,170 | -2.5 % | 2.2 % | -0.6 | 7.3 % |
| 30 | Dallas, TX | -9 | $368,683 | -0.4 % | 1.0 % | -0.4 | 1.5 % |
| 31 | Nashville, TN | 2 | $436,301 | 1.7 % | 2.2 % | -0.8 | -10.8 % |
| 32 | Seattle, WA | 0 | $735,683 | 5.1 % | 1.9 % | -1.0 | -23.5 % |
| 33 | Baltimore, MD | 10 | $386,001 | 3.6 % | 0.8 % | -0.2 | -46.9 % |
| 34 | Los Angeles, CA | -11 | $949,057 | 4.6 % | 1.7 % | -0.4 | -26.1 % |
| 35 | Las Vegas, NV | -23 | $428,725 | 5.1 % | 1.1 % | 0.2 | -18.3 % |
| 36 | San Antonio, TX | 13 | $280,603 | -1.8 % | 0.3 % | 0.2 | 22.7 % |
| 37 | Sacramento, CA | -10 | $577,630 | 2.1 % | 0.0 % | 0.0 | -29.9 % |
| 38 | Houston, TX | 9 | $306,191 | 0.6 % | 0.6 % | -0.3 | 1 % |
| 39 | Chicago, IL | -17 | $321,484 | 5.4 % | 1.2 % | -0.5 | -48.6 % |
| 40 | Jacksonville, FL | -9 | $353,501 | -0.9 % | 1.9 % | -0.8 | 14.1 % |
| 41 | New York, NY | 4 | $677,368 | 6.4 % | 1.3 % | 0.3 | -55.9 % |
| 42 | Milwaukee, WI | 2 | $343,920 | 5.3 % | 2.4 % | -1.6 | -27.1 % |
| 43 | Memphis, TN | -30 | $233,885 | 1.1 % | 2.3 % | -1.7 | -1.2 % |
| 44 | Denver, CO | 4 | $579,604 | 0.8 % | 0.1 % | -0.6 | 4.3 % |
| 45 | Minneapolis, MN | 1 | $368,562 | 2.5 % | 0.2 % | -0.8 | -26.7 % |
| 46 | Austin, TX | -6 | $444,248 | -3.2 % | -0.4 % | -0.6 | 33.7 % |
| 47 | Portland, OR | -10 | $543,814 | 1.8 % | 0.3 % | -1.3 | -19.3 % |
| 48 | San Jose, CA | -6 | $1,588,186 | 7.9 % | -0.2 % | -1.3 | -34.8 % |
| 49 | San Francisco, CA | -19 | $1,140,718 | 2.7 % | -1.7 % | -1.1 | -3.5 % |
| 50 | New Orleans, LA | 0 | $235,657 | -1.4 % | -3.8 % | -0.9 | 61.1 % |
About Zillow Group:
Zillow Group, Inc. (Nasdaq: Z and ZG) is reimagining real estate to make home a reality for more and more people. As the most visited real estate website in the United States, Zillow and its affiliates help people find and get the home they want by connecting them with digital solutions, dedicated partners and agents, and easier buying, selling, financing, and renting experiences.
Zillow Group’s affiliates, subsidiaries and brands include Zillow®, Premier Agent®, Zillow Home Loans℠, Zillow Rentals®, Trulia®, Out East®, StreetEasy®, HotPads®, ShowingTime+℠, Spruce®, and Follow Up Boss®.
All marks herein are owned by MFTB Holdco, Inc., a Zillow affiliate. Zillow Home Loans, LLC is an Equal Housing Lender, NMLS #10287 (www.nmlsconsumeraccess.org). © 2025 MFTB Holdco, Inc., a Zillow affiliate.
(ZFIN)


Consumer Corner
Deed fraud can cause vulnerable Detroiters to lose their homes – here’s why it’s hard to catch the thieves
Deed fraud is rising in Detroit, where forged deeds can strip vulnerable homeowners of their property. Here’s how title theft works, why it’s hard to catch, and what reforms could help.
Donovan McCarty, Michigan State University
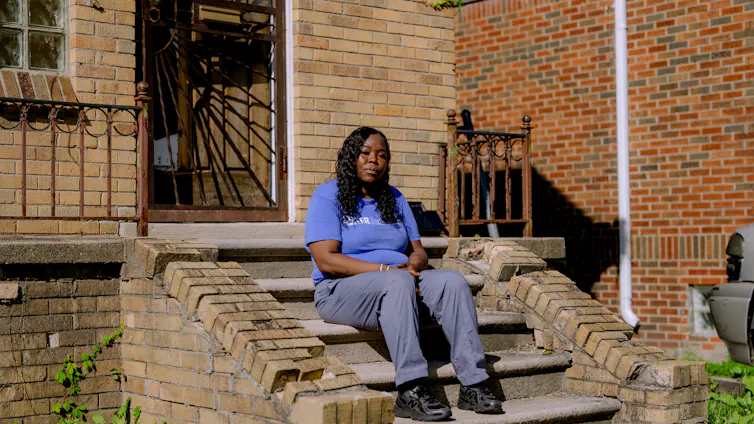
Buying her first home on Detroit’s far east side in 2021 was the moment when a lifelong dream finally came within reach for Kim Page.
“I accomplished something that I always wanted to do,” said Page, who grew up in the city. “I always wanted to buy my own home since I was like 18. I never wanted to rent from anyone.”
Page said she had saved US$15,000 and used $3,800 in cash to buy the single-family brick house on Britain Street. The house, owned by a friend planning to move out of Detroit, was “damaged pretty bad,” Page recalls. But the house was hers to care for, and she was determined to fix what was broken.
For the next several years, Page poured her sweat and paychecks into the property. Working first as a welder at automotive supplier Fisher Dynamics, and later as a phlebotomist, she paid for a dumpster, windows, a door, ceiling repair and an awning above her front porch. Page invested $27,000 in needed repairs and, in 2022, happily moved in.
But in August 2023, a storm damaged her roof. By March 2024, mold had grown inside the property, which made Page struggle to breathe; she moved in with family. She returned to the home in April 2024 for an appointment with a representative from the Federal Emergency Management Agency. That’s when Page noticed the locks had been changed. Perplexed but undeterred, she broke down the back door to get inside and purchased new locks, which she installed.
Then on a hot, summer day in July 2024, Page came home to discover all her locks had been changed again.
Searching for answers, Page called the Wayne County Register of Deeds’ Mortgage and Deed Fraud Unit. The staff confirmed she was a victim of deed fraud – a crime where scammers forge signatures to record a phony transfer of property ownership. Once criminals hijack the title, they can sell the property, rent it out or drain its equity with mortgages, potentially leaving the rightful owner to face the legal and financial fallout.
“I just was in shock,” Page said. “I can’t believe somebody really did this to me.”
A nationwide problem that’s hard to nail down

Page reached out to me for help in March 2025. I’m a housing attorney, assistant professor at Michigan State University College of Law and director of the Housing Justice Clinic. I have represented dozens of victims of deed fraud.
I have also studied how property recording systems respond – or, more accurately, fail to respond – to fraud. My work examines how procedural gaps in title systems disproportionately harm elderly, low-income and minority homeowners.
Nationwide, deed fraud – also called quit claim deed fraud or home title theft – is a growing problem, including in New York, Boston, Miami and Philadelphia.
Exactly how big a problem it is, is hard to know. The FBI does not track deed fraud specifically, instead grouping it into a larger category of real estate crimes.
From 2019 through 2023, 58,141 victims in the U.S. reported $1.3 billion in losses relating to real estate crime, the FBI says. However, that number is likely undercounted because many people don’t know where to report it, are embarrassed they were victims or don’t know yet they have been targeted.
In Detroit, deed fraud may be particularly prevalent because so many housing deals are made in cash and many properties owe back taxes. The Wayne County Mortgage and Deed Fraud Unit has tracked more than 13,000 inquiries regarding deed fraud and has opened over 2,300 cases throughout Wayne County since 2005.
Without oversight, the crime often goes undetected
Committing deed fraud is remarkably simple.
A deed is the legal document that transfers ownership of a home or other real property from one person to another. When a home is bought or sold, a deed is legally drawn up to reflect the transfer of ownership. That deed is then recorded with a county register of deeds, providing public notice of who legally owns the property.
A fraudster can forge the signature of the real owner – sometimes someone who is deceased. They can file a deed that appears valid on its face but isn’t.
They then record that false deed with a county register of deeds, the local government office that keeps public land records and other documents showing ownership, claiming title to property they do not actually own.
Fraudsters often target vulnerable people and properties, including elderly owners, families dealing with inherited homes, and houses that appear vacant or neglected, such as those behind on property taxes.
The incentive is clear: Once a fraudster appears to hold title, they can try to sell the property to an investor or an unsuspecting buyer looking for stable housing. I have seen fraudsters secure as much as $50,000 from one deal when they obtained a mortgage based on a fraudulent deed. One notable case of fraud targeted Elvis Presley’s former estate, Graceland.
In Michigan and most other states, recording offices do not have authority to substantively review a deed to determine whether it is fraudulent. If the document complies with technical formatting requirements, such as margin and font size, it must be recorded. Once stamped and indexed, the deed appears legitimate and can easily trick desperate buyers, investors, financial institutions and even police officers, lawyers and judges.
In other words, the recording process is largely administrative, not investigative. The government office accepts and files the document without first verifying that the person signing it actually had the legal right to transfer the property.
That means a fraudulent deed can enter the public record, look valid to the outside world and remain undiscovered for months or even years.
Detroit is vulnerable
The housing market helps explain why Detroiters are more vulnerable to deed fraud.
Homes in Black neighborhoods nationwide are systematically undervalued compared with similar homes in white neighborhoods. Black borrowers are also more likely to be denied conventional mortgage loans. Detroit is about 73% Black, with a median household income of roughly $39,000 and a poverty rate exceeding 30%.
In a market where access to traditional financing is uneven and home prices are relatively low, cash sales accounted for 4 in 10 sales in February 2024.
Lenders, brokers and title companies act as informal gatekeepers when people purchase a home using a mortgage. In cash sales, those actors are absent, and there are fewer opportunities to detect irregularities in the documented history showing how title passed from one owner to the next over time.
Illegal tax practices led to thousands of foreclosed homes
Property tax distress attracts fraudsters. Fraudsters seem to rely on publicly available tax foreclosure lists to identify properties that appear abandoned. They then pay the past-due taxes to remove the property from foreclosure and attempt to sell or mortgage the property using their fraudulent deed.
The fraudsters may also assume that the owner lacks the resources to wage a prolonged legal fight to recover title if they do uncover their scheme. In many cases, that assumption proves correct.
Michigan’s Constitution caps assessments at 50% of market value, but researchers have found that from 2009 to 2015, a majority of Detroit homes were assessed above that limit. Once those inflated bills went unpaid, interest, penalties and fees accumulated, often ending in tax foreclosure.
More than 100,000 Detroit residents lost homes in that crisis, and homeowners were overtaxed by at least $600 million between 2010 and 2016.
In a city already destabilized by unlawful tax foreclosure, fraudsters found opportunity in homes burdened by vacancy and broken chains of ownership.
The burdens that deed fraud victims face
My first encounter with deed fraud came in July 2023. I received a request for legal assistance from a man who said he had been evicted from a home he claimed to own. Honestly, I didn’t believe him.
But when I pulled the court records and deeds, I learned he was right.
A fraudulent deed had been filed on his property, stripping him of title. The fraudsters then filed an eviction case against him.
The owner had no phone and no internet access to attend the virtual hearings. The court entered a judgment to evict him. A bailiff came, broke down his door and threw his belongings into a dumpster.
It took six months and two separate court cases before he was finally able to return to his home. He never recovered his belongings – and we never found the fraudster.
There are many other hardships for a legitimate owner. A fraudulent deed can prevent homeowners from selling their property, refinancing or accessing financial assistance programs.
To clear title, owners must file a quiet title lawsuit – a court action used to resolve disputes over who legally owns a property.
But quiet title cases are complex legal proceedings.
They require multiple filings, hearings and strict compliance with procedural rules. Even when fraud is obvious – for example, when a deed was signed by someone who was already deceased – courts generally require formal litigation to remove the cloud from the title.
Likewise, the legal process of notifying the defendant can be especially burdensome. Fraudsters often use fictitious names and addresses, making them difficult or impossible to locate. Even uncontested cases typically take months. If a defendant appears and disputes ownership, litigation can stretch for years.
Filing fees, service costs and other litigation expenses accumulate quickly. Hiring an attorney can cost several thousand dollars, and some victims have reported spending tens of thousands clearing title to their homes.
As for Kim Page, her case is still ongoing. After being locked out of her home, she had to move in with relatives for over a year, putting a strain on their relationship. She was eventually able to return to her home, but the legal dispute over ownership has not been resolved.
On top of that, she is facing a counter-lawsuit from the company that filed the fraudulent deed, requesting $50,000 for repairs the company made to the home while Page was locked out, along with property taxes and utility bills that the company says it paid to the county and utility companies on her behalf. The county opened an investigation, but it remains unresolved. As a result, she still has no idea who orchestrated the scheme.
While there are free legal services organizations to help, they have limited capacity, and income thresholds exclude some homeowners who still cannot afford private counsel.
Legal reforms likely won’t resolve systemic issues
Across the country, state legislatures have begun responding. Twenty-one have enacted deed fraud legislation, and 15 more have proposed it.
Another common intervention is fraud alert systems, which notify owners when any documents that impact the title of their property are recorded.
Other reforms increase notarial requirements or enhance criminal penalties.
These measures may deter some misconduct, but they do little to reduce the burden on victims once a fraudulent deed has been recorded.
In my assessment, meaningful reforms focus on empowering registers of deeds to substantively review suspicious documents before recording them; simplifying and expediting quiet title proceedings; and expanding civil remedies so victims can recover the costs associated with clearing their title.
Some jurisdictions like Texas and Florida have adopted streamlined procedures that allow victims to initiate quiet title actions using standardized forms with reduced fees. Others permit recorders, prosecutors or judges to act when fraud has already been established.
In Michigan, I am working with lawmakers and stakeholders to develop comprehensive legislation addressing these issues. Bills are expected to be introduced later this year.
At the same time, my clinic has begun exploring how technology can help identify fraudulent deeds already in the record. We are working with computer scientists to evaluate whether artificial intelligence tools could flag suspicious filings and potentially prevent fraudulent documents from being accepted in the future.
No property system can eliminate fraud entirely. Preventive and punitive measures may limit fraud, but they cannot eliminate the incentive to commit it. For fraudsters, the payoff can be substantial.
Conversations about the issue often begin and end with the mechanics of the crime or the procedural burdens victims face afterward. Far less attention is paid to the housing market conditions that make some communities especially vulnerable in the first place.
Page, now 42 and working as a transporter for Sinai-Grace Hospital, has been coping with the stress of legal proceedings for the past two years and living with a heart condition so serious that she got a defibrillator.
The longtime Detroiter is fed up – with the lack of police help to find the fraudster, as well as the court system. All she wants is to be the rightful owner of the home.
“Give me my house back,” Page said.
Detroit editor Eleanore Catolico contributed reporting.
Donovan McCarty, Director, Housing Justice Clinic at Michigan State University College of Law, Michigan State University
This article is republished from The Conversation under a Creative Commons license. Read the original article.
📰 Enjoying STM Daily News? Join the conversation!
💬 Leave a comment, share your thoughts, and subscribe to our newsletter for the latest stories, updates, and “News You Can Use This Moment!” delivered to your inbox.
Stay connected with STM Daily News!
Robert I. Harris, Georgia Institute of Technology
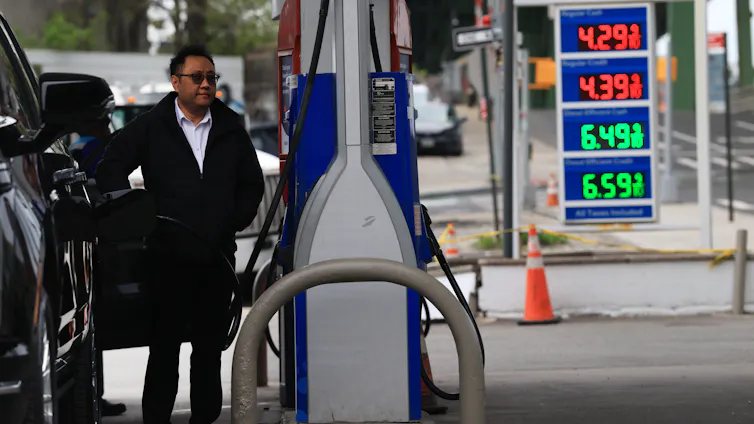
The U.S. Energy Information Administration expects nationwide retail gasoline prices to average near US$4.30 a gallon for April 2026 – the highest monthly average of the year. The political response has been familiar. Georgia has suspended its state gas tax, other states are weighing their own tax holidays, and the White House has issued a temporary waiver of a law known as the Jones Act in hopes of moving more domestic fuel to East Coast ports.
As an energy economist, I am often asked about what contributes to gas prices and what different policies can do to affect them.
The price of a retail gallon of gas is the sum of four things: the cost of crude oil, refining, distribution and marketing, and taxes.
In nationwide figures from January 2026, crude oil accounted for about 51% of the pump price, refining roughly 20%, distribution and marketing about 11% and taxes about 18%. That mix shifts with conditions: When crude oil prices spike, that can drive more than 60% of the price; when the price drops, taxes and logistics are larger shares of the cost.
Crude oil is the biggest ingredient
Because the price of crude oil is the largest element, most of the price at the pump is derived from the global oil market.
Usually, big swings in crude prices come mainly from shifts in global demand and expectations – not from supply disruptions, according to widely cited research in 2009 by the economist Lutz Kilian.
But what is happening in early 2026 with the war in Iran is one of the exceptions: a classic supply shock. Severe disruptions to shipping through the Strait of Hormuz and attacks on Middle East oil infrastructure have taken millions of barrels a day off the global market.
Most drivers generally can’t quickly reduce how much they drive or how much gas they use when prices rise, so gasoline demand doesn’t change much in the short run. That means a jump in crude costs tends to result in people paying more rather than driving less.
Refining, regulations and the California puzzle
Refining turns crude into gasoline at industrial scale. The U.S. doesn’t have a single gasoline market, though. Roughly a quarter of U.S. gasoline is a cleaner-burning blend of petroleum-derived chemicals called “reformulated gasoline,” which is required in urban areas across 17 states and the District of Columbia to reduce smog.
California uses an even stricter formulation that few out-of-state refineries make. California is also geographically isolated: No pipelines bring gasoline in from other U.S. refining regions.
California’s gasoline prices have long run above the national average, explained in part by higher state taxes and stricter environmental rules. But since a refinery fire in Torrance, California, in 2015 reduced production capacity, the state’s prices have been about 20 to 30 cents a gallon higher than what those factors would indicate.
Energy economist and University of California, Berkeley, professor Severin Borenstein has called this the “mystery gasoline surcharge” and attributes it to the fact that there isn’t as much competition between refineries or gas stations in California as in other states. California’s own Division of Petroleum Market Oversight says the surcharge cost the state’s drivers about $59 billion from 2015 to 2024. It’s not exactly clear who is getting that money, but it could be gas stations themselves or refineries, through complex contracts with gas stations.
Getting the gas into your car
The distribution and marketing category covers the costs of everything involved in getting the gasoline from the refinery gate to your tank.
Gasoline moves by pipeline, ship, rail and truck to wholesale terminals, and then by local delivery truck to service stations.
At the retailer’s end, the key factors are station rent and labor, the cost to buy gasoline in bulk to be able to sell it, credit card fees of as much as 6 to 10 cents a gallon at current prices, and franchise fees paid to the national brand, such as Sunoco or ExxonMobil, for permission to put their branding on the gas station.
Most gas station operators net only a few cents per gallon on fuel itself – which is why many gas stations are really convenience stores with pumps out front. Borenstein and some of his collaborators have also documented that retail gas prices rise quickly when wholesale costs climb but fall slowly when wholesale costs drop.
The question of gas tax holidays
The federal government charges a tax on fuel, of 18.4 cents a gallon for gasoline and 24.3 cents a gallon for diesel. States charge their own taxes, ranging from 70.9 cents a gallon for gas in California to 8.95 cents in Alaska.
When gas prices rise, many politicians start talking about temporarily suspending their state’s gas tax. That does reduce prices, but not as much as politicians – or consumers – might hope. Research on past gas tax holidays has found that consumers get about 79% of the reduction in gas taxes. That means oil companies and fuel retailers keep about one-fifth of the tax cut for themselves rather than passing that savings to the public.
Gas tax holidays also reduce funding for what the taxes are designed to pay for, typically roads and bridges. That pushes road and bridge upkeep costs onto future drivers and general taxpayers.
There is an additional problem, too: Taxes on gasoline are supposed to charge drivers for some of the costs their driving imposes on everyone else – carbon emissions, local air pollution, congestion and crashes. But Borenstein has found that U.S. fuel tax levels are already far below the true cost to society. Removing the tax on drivers effectively raises the costs for everyone else.
The Jones Act: A small number that adds up
The 1920 Jones Act is a federal law that requires cargo moving between U.S. ports to travel on vessels built and registered in the U.S., owned by U.S. citizens, and crewed primarily by U.S. citizens and permanent residents. Of the world’s 7,500 oil tankers, only 54 meet this requirement. Only 43 of these can transport refined fuels such as gasoline.
So, despite significant refining capacity on the Gulf Coast, some U.S. gasoline is exported overseas even as the Northeast imports fuel, in part reflecting the relatively high cost of moving fuel between U.S. ports.
Economists Ryan Kellogg and Rich Sweeney estimate that the law raises East Coast gasoline prices by about a penny and a half per gallon on average, costing drivers roughly $770 million a year. In light of the war’s effect on gas prices, the Trump administration has temporarily suspended the Jones Act requirements – an action more commonly taken when hurricanes knock out Gulf Coast refineries and pipeline networks.
What moves the number
The result of all these factors is that the price that drivers see at the pump mostly reflects the global price of crude, plus a stack of domestic costs, only some of which are inefficient.
Tax holidays give a partial, short-lived rebate. Jones Act waivers trim pennies, though permanent repeal may cause more fundamental changes, such as reduced rail and truck transport of all goods, which could lower costs, emissions and infrastructure damage associated with cargo transportation. Harmonizing fuel blends across states and seasons may lower prices somewhat, but likely at the expense of increased emissions.
Ultimately, the best protection against oil price shocks is a more efficient gas-burning vehicle, or one that doesn’t burn gasoline at all. In the meantime, the best I can offer as an economist is clarity about what that $4.30 actually buys.
Robert I. Harris, Assistant Professor of Economics, Georgia Institute of Technology
This article is republished from The Conversation under a Creative Commons license. Read the original article.
📰 Enjoying STM Daily News? Join the conversation!
💬 Leave a comment, share your thoughts, and subscribe to our newsletter for the latest stories, updates, and “News You Can Use This Moment!” delivered to your inbox.
Stay connected with STM Daily News!
health and wellness
Heat waves can leave homes dangerously hot – even for young, healthy adults
Heat waves can turn homes into dangerous heat traps—especially during blackouts or in houses without AC—pushing indoor temperatures and humidity into lethal territory even for young, healthy adults, not just the elderly.

Heat waves can leave homes dangerously hot – even for young, healthy adults
Zoltan Nagy, Eindhoven University of Technology
Most people know that heat waves can be dangerous, but what they may not realize is that the heat indoors can be much worse than outdoors.
When the power goes out and air conditioning stops, or in homes without cooling, a house starts to function like a greenhouse during a heat wave. Heat enters through windows and walls and has nowhere to go. Air stagnates.
Within hours, indoor temperatures can climb well above what the thermometer shows outside, especially on upper floors and in rooms with south-facing windows. Over longer periods, especially if temperatures don’t cool off overnight, conditions can become lethal.
Most heat-related deaths occur indoors. When a heat dome sent temperatures soaring in the Pacific Northwest in 2021, 98% of the more than 600 deaths in British Columbia happened inside homes. Washington and Oregon also saw high numbers of deaths in homes that lacked air conditioning.
In Europe, where only 1 in 10 households have air conditioning, heat waves killed an estimated 60,000 people in 2022 and 47,000 in 2023, largely inside buildings never designed for these temperatures.
People of all ages are at risk in heat waves like these. I spent eight years at the University of Texas at Austin studying how buildings respond to extreme heat. In a recent study, my team assessed the heat risk in every single-family home in Austin.
We found that even younger, healthy adults face far more risk than they realize.
How hot is too hot for a human body?
Your body maintains a core temperature of about 98.6 degrees Fahrenheit (37 degrees Celsius). To cool down, it pushes blood to the skin and sweats. But when air temperature is high, that convective cooling weakens. When humidity is also high, sweat cannot evaporate.
If the body has no way to release heat, core temperature rises. If the core temperature increases past about 104 F (40 C), the body’s thermoregulation starts to fail. Past 109 F (42.8 C), death becomes likely.

What makes indoor heat especially dangerous is that it does not let up at night in homes that lack air conditioning. Outdoor temperatures typically drop after sunset, and someone outside can get a few hours of recovery. But a poorly insulated home that has been absorbing heat all day releases that heat slowly, keeping indoor temperatures elevated through the night. A person inside the home never gets a break.
After two or three nights of this, even healthy people start to be at serious risk for heat-related illnesses.
Why homes heat up more than people expect
People tend to underestimate indoor heat for a few reasons.
One is that the thermostat typically sits on one wall in one room. It does not tell what the temperature is in an upstairs bedroom or near a sun-facing window. In older, underinsulated homes, the actual felt temperature can exceed 90 F (32.2 C) even when a thermostat reads 75 F (23.9 C). The hot walls, ceilings and windows can radiate heat directly onto your body.
Another reason is that people assume all homes respond to heat the same way. However, a newer home with double-pane windows and good insulation acts like a thermos, keeping heat out for a longer time. An older home with single-pane windows and cracks in the walls heats up fast.
Two houses on the same street, exposed to the same outdoor conditions, can have completely different temperatures inside. And in a blackout, where neither home has cooling, those differences can become a matter of life and death.
What we found in Austin
Our study combined two datasets. From Austin’s tax appraisal records, we pulled basic property information, such as the year the home was built, the size and the number of stories for each of the city’s 213,000 single-family homes. We then matched each home to the most similar energy simulation models in a U.S. Department of Energy database that contains thousands of detailed, physics-based building energy models representing the U.S. residential building stock.
Using those models, we simulated each building’s indoor temperatures over time during a three-day heat wave and power outage with outdoor temperatures above 110 F (43 C).
We found that 85% of homes got hot enough to pose a significant risk of death for an elderly occupant. But what surprised us was the risk to younger people.
Under today’s climate conditions in Austin, about 15% of homes already have the potential to get hot enough without air conditioning to pose serious heat risks to healthy adults. Under future warming scenarios, that number jumps to as high as 65% if average summer highs reach 104 F (40 C). Further, climate projections for Austin show that heat waves will double in frequency by the end of the century.
We found three types of buildings and accompanying risks:
- Resilient homes, which are newer and well insulated, tended to have temperature and humidity conditions that would be survivable for an elderly occupant throughout the simulated heat wave with blackout.
- Critical-risk buildings, which are mostly older homes, became dangerous almost immediately.
- And then there was the middle group – homes where temperatures rose slowly during the simulated blackout, day by day, possibly giving occupants a false sense of security until it was too late.
Texas has already seen conditions like our case study’s – a heat wave paired with a power outage. In 2024, a derecho knocked out power for nearly 900,000 Houston households while the heat index climbed to 100 F (37.8 C). Seven weeks later, Hurricane Beryl cut power to 2.6 million homes, leaving them without power for over three days, with temperatures over 90 F (32.2 C).
What you can do to stay safe
If you can’t get cooling at home, there are steps you can take that can help.
Move to the lowest floor of your home, where it will be coolest. Close the blinds and curtains on sun-facing windows. Drink water constantly to stay hydrated, which is essential for regulating body temperature.
If you’re facing a blackout, be sure to also check on elderly neighbors, especially those living alone. You can also try to find a public cooling center; many cities now open them during heat emergencies.
Longer term, upgrades such as reflective window film, attic insulation and lighter-colored roofing can reduce how much a home heats up. After the 2021 heat dome, British Columbia’s coroner recommended updating building codes to address heat.
Our own findings point in the same direction: We propose that new homes should be required by building codes to maintain conditions in which at least light physical activity remains possible for all occupants for at least 72 hours during a power outage.
As summers get hotter with climate change and blackouts become more frequent, the risks of people suffering heat illnesses will only continue to rise.
Zoltan Nagy, Professor of Building Services, Eindhoven University of Technology
Heat waves can leave homes dangerously hot – even for young, healthy adults
This article is republished from The Conversation under a Creative Commons license. Read the original article.
💪 Your health journey starts here! Explore the latest health news, fitness tips, wellness trends, and healthy living advice. Share your thoughts in the comments and subscribe to the STM Daily News newsletter to stay informed and inspired every day.