Science
Separating out signals recorded at the seafloor
Roger Bryant and David Fike’s research reveals that pyrite sulfur isotopes mainly reflect local conditions, shifting fundamental understanding of oceanic environmental studies.
Last Updated on November 1, 2024 by Daily News Staff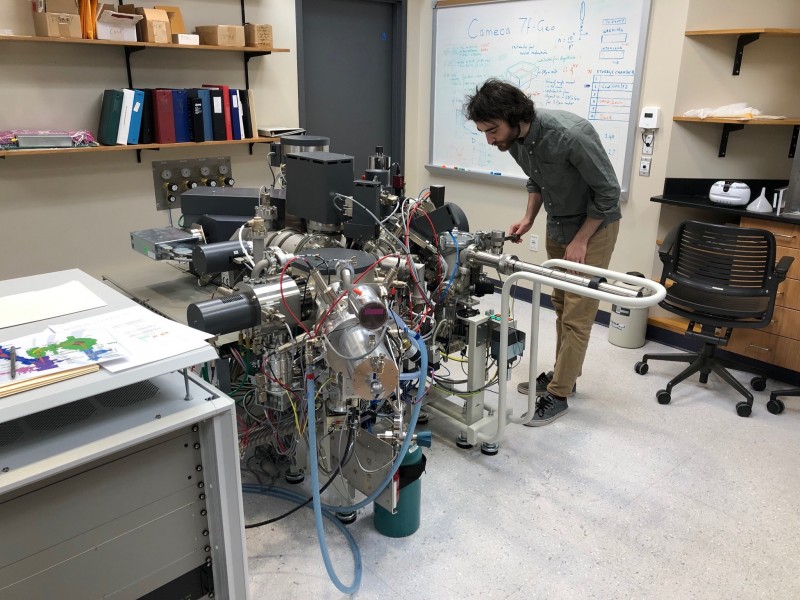
Roger Bryant studied ocean floor core samples at the Secondary Ion Mass Spectrometry (SIMS) facility at Washington University in St. Louis during his PhD studies. Bryant and David Fike have used this data to prove a discovery that will fundamentally change how scientists use pyrite sulfur isotopes to study oceanic conditions.
« Separating out signals recorded at the seafloor
Newswise — Blame it on plate tectonics. The deep ocean is never preserved, but instead is lost to time as the seafloor is subducted. Geologists are mostly left with shallower rocks from closer to the shoreline to inform their studies of Earth history.
Signals from the Sea
“We have only a good record of the deep ocean for the last ~180 million years,” said David Fike, the Glassberg/Greensfelder Distinguished University Professor of Earth, Environmental, and Planetary Sciences in Arts & Sciences at Washington University in St. Louis. “Everything else is just shallow-water deposits. So it’s really important to understand the bias that might be present when we look at shallow-water deposits.”
One of the ways that scientists like Fike use deposits from the seafloor is to reconstruct timelines of past ecological and environmental change. Researchers are keenly interested in how and when oxygen began to build up in the oceans and atmosphere, making Earth more hospitable to life as we know it.
For decades they have relied on pyrite, the iron-sulfide mineral known as “fool’s gold,” as a sensitive recorder of conditions in the marine environment where it is formed. By measuring the bulk isotopic composition of sulfur in pyrite samples — the relative abundance of sulfur atoms with slightly different mass — scientists have tried to better understand ancient microbial activity and interpret global chemical cycles.
But the outlook for pyrite is not so shiny anymore. In a pair of companion papers published Nov. 24 in the journal Science, Fike and his collaborators show that variations in pyrite sulfur isotopes may not represent the global processes that have made them such popular targets of analysis.
Instead, Fike’s research demonstrates that pyritte responds predominantly to local processes that should not be taken as representative of the whole ocean. A new microanalysis approach developed at Washington University helped the researchers to separate out signals in pyrite that reveal the relative influence of microbes and that of local climate.
For the first study, Fike worked with Roger Bryant, who completed his graduate studies at Washington University, to examine the grain-level distribution of pyrite sulfur isotope compositions in a sample of recent glacial-interglacial sediments. They developed and used a cutting-edge analytical technique with the secondary-ion mass spectrometer (SIMS) in Fike’s laboratory.
“We analyzed every individual pyrite crystal that we could find and got isotopic values for each one,” Fike said. By considering the distribution of results from individual grains, rather than the average (or bulk) results, the scientists showed that it is possible to tease apart the role of the physical properties of the depositional environment, like the sedimentation rate and the porosity of the sediments, from the microbial activity in the seabed.
“We found that even when bulk pyrite sulfur isotopes changed a lot between glacials and interglacials, the minima of our single grain pyrite distributions remained broadly constant,” Bryant said. “This told us that microbial activity did not drive the changes in bulk pyrite sulfur isotopes and refuted one of our major hypotheses.”
“Using this framework, we’re able to go in and look at the separate roles of microbes and sediments in driving the signals,” Fike said. “That to me represents a huge step forward in being able to interpret what is recorded in these signals.”
In the second paper, led by Itay Halevy of the Weizmann Institute of Science and co-authored by Fike and Bryant, the scientists developed and explored a computer model of marine sediments, complete with mathematical representations of the microorganisms that degrade organic matter and turn sulfate into sulfide and the processes that trap that sulfide in pyrite.
“We found that variations in the isotopic composition of pyrite are mostly a function of the depositional environment in which the pyrite formed,” Halevy said. The new model shows that a range of parameters of the sedimentary environment affect the balance between sulfate and sulfide consumption and resupply, and that this balance is the major determinant of the sulfur isotope composition of pyrite.
“The rate of sediment deposition on the seafloor, the proportion of organic matter in that sediment, the proportion of reactive iron particles, the density of packing of the sediment as it settles to the seafloor — all of these properties affect the isotopic composition of pyrite in ways that we can now understand,” he said.
Importantly, none of these properties of the sedimentary environment are strongly linked to the global sulfur cycle, to the oxidation state of the global ocean, or essentially any other property that researchers have traditionally used pyrite sulfur isotopes to reconstruct, the scientists said.
“The really exciting aspect of this new work is that it gives us a predictive model for how we think other pyrite records should behave,” Fike said. “For example, if we can interpret other records — and better understand that they are driven by things like local changes in sedimentation, rather than global parameters about ocean oxygen state or microbial activity — then we can try to use this data to refine our understanding of sea level change in the past.”
Source: Washington University in St. Louis
The science section of our news blog STM Daily News provides readers with captivating and up-to-date information on the latest scientific discoveries, breakthroughs, and innovations across various fields. We offer engaging and accessible content, ensuring that readers with different levels of scientific knowledge can stay informed. Whether it’s exploring advancements in medicine, astronomy, technology, or environmental sciences, our science section strives to shed light on the intriguing world of scientific exploration and its profound impact on our daily lives. From thought-provoking articles to informative interviews with experts in the field, STM Daily News Science offers a harmonious blend of factual reporting, analysis, and exploration, making it a go-to source for science enthusiasts and curious minds alike. https://stmdailynews.com/category/science/

News
Joby Aviation and Toyota kick off manufacturing alliance to scale electric air taxi production
Joby Aviation and Toyota launch a joint venture to improve productivity, quality, and cost as they prepare to scale electric air taxi production.
Joby Aviation and Toyota Motor Corporation have launched the initial phase of a strategic manufacturing alliance aimed at accelerating commercial production of electric air taxis—an early step the companies say is designed to make “air mobility for all” a practical, everyday reality.
Announced June 30, 2026, the partnership formalizes a new joint venture that will combine Joby’s electric aviation development with Toyota’s production systems and operational expertise. The near-term focus: building the groundwork for commercial production while pushing improvements in productivity, quality, and cost—key factors as the industry moves from prototypes to scaled manufacturing.

What the joint venture is designed to do
According to the companies, the alliance will initially concentrate on:
- Establishing the foundation for commercial production capability
- Advancing manufacturing excellence with an emphasis on productivity, quality, and cost
- Supporting expansion of Joby’s production capacity as it works toward aircraft certification and prepares for anticipated demand
The announcement positions Toyota’s manufacturing playbook—known globally for lean production and continuous improvement—as a lever to help Joby move from development into repeatable, high-quality output at scale.
Why it matters: eVTOLs need scale, not just flight tests
Electric vertical take-off and landing (eVTOL) aircraft have become one of the most closely watched bets in next-generation transportation, but the path to viable air taxi services depends on more than successful test flights. Certification timelines, supply chain readiness, and the ability to produce aircraft consistently (and affordably) are often what separates promising technology from commercial reality.
By forming a joint venture focused on manufacturing readiness, Joby and Toyota are signaling that the next competitive frontier is industrialization—how quickly and reliably eVTOL aircraft can be built to meet safety standards and market demand.
Related Links for Further reading
- Joby Aviation (official): https://www.jobyaviation.com
- Joby Investor Relations / News (official updates & filings): https://ir.jobyaviation.com
- Toyota Newsroom (official): https://www.toyotanewsroom.com
- Toyota Global (corporate overview): https://global.toyota/en
- FAA Advanced Air Mobility / Air Taxis (context): https://www.faa.gov/air-taxis
What executives are saying
Joby founder and CEO JoeBen Bevirt emphasized the long-running relationship between the companies, calling the joint venture a reflection of shared confidence in the opportunity ahead.
“Toyota has been by Joby’s side for nearly a decade, providing invaluable guidance and support as we built the foundation for manufacturing our aircraft,” Bevirt said. “Together, we share a vision of making aerial mobility an everyday reality.”
Toyota Motor Corporation Chairman Akio Toyoda framed air mobility as an extension of the company’s broader mission.
“Since our founding, we’ve been guided by the philosophy of providing mobility for all,” Toyoda said, adding that Toyota views air mobility as “a natural extension of that philosophy—from the ground into the sky.”
About the companies
Joby Aviation (NYSE: JOBY) is a California-based transportation company developing an all-electric eVTOL air taxi. The company intends to operate its own air taxi service in cities worldwide and sell aircraft to other operators and partners.
Toyota (NYSE: TM) has operated in North America for nearly 70 years and says it is focused on sustainable, next-generation mobility through Toyota and Lexus brands. Toyota reports nearly 64,000 employees in North America, 14 manufacturing plants, and more than 1,800 dealerships. The company also noted that its North Carolina plant began assembling automotive batteries for electrified vehicles in 2025.
What to watch for next
For readers tracking the air taxi sector, the next milestones will likely center on:
- Details on how the joint venture will be structured operationally
- Updates on Joby’s certification progress and production ramp timelines
- Signs of how manufacturing improvements translate into cost reductions and throughput
- Additional agreements or expanded collaboration as the alliance progresses
While the companies highlighted expected benefits, they also noted the usual forward-looking risks—such as regulatory certification timelines, market conditions, and the ability to finalize additional agreements.
Source: Toyota Motor North America / PRNewswire (June 30, 2026)
📰 Enjoying STM Daily News? Join the conversation!
💬 Leave a comment, share your thoughts, and subscribe to our newsletter for the latest stories, updates, and “News You Can Use This Moment!” delivered to your inbox.
Stay connected with STM Daily News!
STM Blog
From Hand Signals to Smart Crosswalks: The Evolution of the Modern Pedestrian Signal
Discover the history of the modern pedestrian signal, from Garrett A. Morgan’s groundbreaking traffic signal to today’s smart, accessible crosswalks.
Last Updated on July 12, 2026 by Daily News Staff
Every day, millions of people rely on pedestrian signals to cross busy street safely. A glowing white walking figure, an orange-red hand, and a countdown timer have become familiar sights around the world. While these signals may seem like simple pieces of infrastructure, they are the result of more than a century of innovation, engineering, and public safety improvements.
The modern pedestrian signal did not appear overnight. Instead, it evolved through the contributions of inventors, engineers, city planners, and transportation officials who continually refined traffic control systems as cities grew and automobiles became more common.
The Early Days of Traffic Control
Before electric traffic signals, intersections were controlled by police officers, railway-style semaphores, or even hand signals. As horse-drawn wagons gave way to automobiles in the early 1900s, traffic congestion and accidents increased dramatically, creating an urgent need for better traffic management.
One of the earliest electric traffic lights was installed in Cleveland, Ohio, in 1914. It used red and green lights and was manually operated. While it improved vehicle movement, pedestrians still had to judge for themselves when it was safe to cross.
Garrett A. Morgan’s Breakthrough
One of the most important milestones came in 1923 when inventor and entrepreneur Garrett Augustus Morgan received U.S. Patent No. 1,475,024 for an improved traffic signal.
Morgan’s design introduced a third position in addition to “Stop” and “Go.” This intermediate phase temporarily stopped traffic in every direction before allowing vehicles to proceed. The brief pause reduced confusion at intersections and provided additional time for pedestrians to cross safely.
Morgan reportedly developed his design after witnessing a serious traffic accident. His invention demonstrated how thoughtful engineering could improve public safety while making increasingly busy streets more efficient.
Although Morgan did not invent the illuminated “WALK” and “DON’T WALK” pedestrian signal used today, his three-position signal became a foundational step in the evolution of modern traffic control.
The Birth of Dedicated Pedestrian Signals
As cities expanded after World War II, pedestrian safety became an even greater concern. More people were walking in increasingly crowded downtown districts, and separating pedestrian movements from vehicle traffic became a priority.
During the early 1950s, several American cities began experimenting with dedicated pedestrian signals. New York City became one of the first major municipalities to install illuminated “WALK” and “DON’T WALK” signs at busy intersections.
These early systems gave pedestrians their own designated crossing phase, reducing conflicts with turning vehicles and improving safety at some of the nation’s busiest intersections.
Standardization Across America
By the 1960s and 1970s, traffic engineers recognized the importance of creating consistent traffic control devices nationwide.
The Manual on Uniform Traffic Control Devices (MUTCD) established national standards for traffic signs, pavement markings, and pedestrian signals. Standardized designs helped ensure that pedestrians could understand crossing signals regardless of where they traveled in the United States.
Eventually, words gave way to internationally recognized symbols—a walking person to indicate it was safe to cross and an upraised hand to indicate pedestrians should wait. These symbols transcended language barriers and improved accessibility for visitors and non-English speakers.
The Countdown Era
One of the most significant modern improvements arrived with pedestrian countdown timers.
Rather than simply flashing a warning, countdown displays show exactly how many seconds remain before the crossing phase ends. Research has shown that countdown timers help pedestrians make better crossing decisions and improve compliance with traffic signals.
Today, countdown timers have become standard equipment at intersections across much of the United States.
Accessibility Takes Center Stage
Modern pedestrian signals are designed to serve everyone.
Accessible Pedestrian Signals (APS) now provide audible tones, spoken messages, vibrating push buttons, and locator sounds that assist pedestrians who are blind or have low vision. These features allow more people to navigate intersections independently and safely.
The continued development of accessible technology reflects a broader commitment to making transportation systems inclusive for all users.
The Future of Pedestrian Safety
Pedestrian signals continue to evolve.
Many cities now use smart traffic systems that detect pedestrians waiting to cross, automatically adjust signal timing based on traffic conditions, and prioritize people walking during busy periods.
Researchers are exploring artificial intelligence, connected vehicle technology, and sensor-based systems capable of communicating directly with autonomous vehicles. Future pedestrian crossings may adapt in real time to weather conditions, crowd sizes, emergency vehicles, and even the needs of older adults or individuals with disabilities.
A Legacy Built by Many Innovators
The pedestrian signal we know today is the product of more than a century of collaboration and innovation.
Early traffic engineers created the first electric traffic lights. Garrett A. Morgan improved intersection safety with his groundbreaking three-position traffic signal. Transportation agencies standardized traffic control devices, while engineers continued refining pedestrian technology through countdown timers, accessible features, and intelligent traffic systems.
Every safe crossing today reflects the work of countless inventors, planners, researchers, and public officials dedicated to protecting lives.
As cities continue to grow and transportation technology advances, the humble pedestrian signal remains one of the most effective—and often overlooked—public safety innovations ever developed.
At STM Daily News, we celebrate the inventors, engineers, and visionaries whose everyday innovations quietly improve life for millions of people. Sometimes the most important inventions aren’t the ones that grab headlines—they’re the ones we depend on every single day without giving them a second thought.
Related Reading
- Federal Highway Administration – Manual on Uniform Traffic Control Devices (MUTCD)
- National Museum of African American History and Culture – Garrett Augustus Morgan
- United States Patent and Trademark Office
- Federal Highway Administration – Accessible Pedestrian Signals
- National Highway Traffic Safety Administration (NHTSA)
🧠 Discover the remarkable innovators, inventors, and trailblazers who helped shape our world but rarely receive the recognition they deserve. Share your thoughts in the comments and subscribe to the STM Daily News newsletter to catch every new Forgotten Genius Friday feature and more inspiring stories delivered to your inbox.
The Earth
Cement has a climate problem — here’s how geopolymers with add‑ins like cork could help fix it
Portland cement drives ~8% of global emissions. Learn how low-carbon geopolymers—enhanced with add-ins like cork—could cut concrete’s footprint.

Alcina Johnson Sudagar, Washington University in St. Louis
Concrete is all around you – in the foundation of your home, the bridges you drive over, the sidewalks and buildings of cities. It is often described as the second-most used material by volume on Earth after water.
But the way concrete is made today also makes it a major contributor to climate change.
Portland cement, the key component of concrete, is responsible for about 8% of global greenhouse gas emissions. That’s because it’s made by heating limestone to high temperatures, a process that burns a large amount of fossil fuels for energy and releases carbon dioxide from the limestone in the process.
The good news is that there are alternatives, and they are gaining attention.
Portland cement: A greenhouse gas problem
Cementlike substances have been used in construction for thousands of years. Architects have found evidence of their use in the pyramids of Egypt and the buildings and aqueducts of the Roman Empire.
The Portland cement commonly used in construction today was patented in 1824 by Joseph Aspdin, a British bricklayer.
Modern cement preparation starts with crushing the excavated raw materials limestone and clay and then heating them in a kiln at around 2,650 degrees Fahrenheit (about 1,450 degrees Celsius) to form clinker, a hard, rocklike residue. The clinker is then cooled and ground with gypsum into a fine powder, which is called cement.
About 40% of the carbon dioxide emissions from cement production come from burning fossil fuels to generate the high heat needed to run the kiln. The rest come as the heat converts limestone (calcium carbonate) to lime (calcium oxide), releasing carbon dioxide.
In all, between half a ton and 1 ton of greenhouse gas is released per ton of Portland cement. Cement is a binding agent that, mixed with water, holds aggregate together to create concrete. It makes up about 10% to 15% of the concrete mix by weight.
Alternative technologies can lower emissions
As populations, cities and the need for new infrastructure expand, the use of cement is growing, making it important to find alternatives with lower environmental costs.

Some techniques for reducing carbon dioxide emissions include substituting some of the clinker – the hard residue typically made from limestone – with supplementary materials such as clay, or fly ash and slag from industries. Other methods reduce the amount of cement by mixing in waste sawdust or recycled materials like plastics.
The long-term solution for reducing cement’s emissions, however, is to replace traditional cement completely with alternatives. One option is geopolymers made from earthen clay and industrial wastes.
Geopolymers: A more climate-friendly solution
Geopolymers can be made by mixing claylike materials that are rich in aluminum and silicon minerals with a chemical activator through a process called geopolymerization. The activator transforms the silicon and aluminum into a structure that will look like cement. All of this can happen at room temperature.
The major difference between cement and geopolymer is that cement is mainly made of calcium, whereas geopolymers are made of silicon and aluminum with some possible calcium in their structure.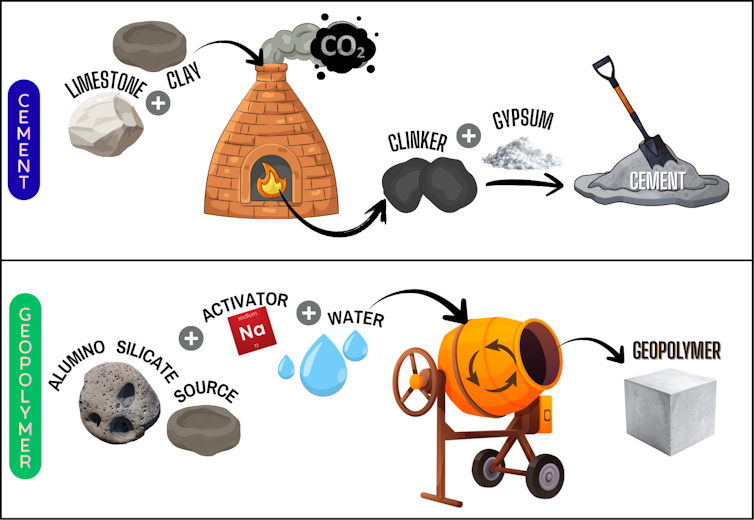
These geopolymers have been found to possess high strength and durability, including resilience in freeze-thaw cycles and resistance to heat and fire, which are important requirements in construction. Studies have found that some geopolymers can provide comparable if not better strength than traditional cement and, because they don’t require heat the way clinker does, they can be produced with significantly lower greenhouse gas emissions.
Geopolymers can also be produced from a variety of raw materials rich in aluminum and silicon, including earthen clays, fly ash, blast furnace slag, rice husk ash, iron ore wastes and recycled construction brick waste. Geopolymer technology can be adapted depending on the clay or industrial waste locally available in a region. https://www.youtube.com/embed/NOj3p6m9M7Q?wmode=transparent&start=0 A brief history of cement and geopolymers. Geopolymer International.
An added advantage of geopolymers is that changes to the mixture can produce a range of features.
For example, I and my co-researchers at the University of Aveiro in Portugal added a small amount of cork industry waste – the leftovers from creating bottle corks – to clay-based geopolymer and found it could improve the strength of the material by up to twofold. The cork particles filled the spaces in the geopolymer structure, making it denser, which increased the strength.
Similarly, additives such as sisal fibers from the agave plant, recycled plastic and steel fibers can change geopolymer properties. The additives do not participate in the geopolymerization process but act as fillers in the structure.
The structure of geopolymers can also be designed to act as adsorbents, attracting toxic metals in wastewater and capturing and storing radioactive wastes. Specifically, incorporating materials like zeolite that are natural adsorbents in the geopolymer structure can make them useful for such applications as well.
Where geopolymers are used now
Geopolymers have been used in many types of construction, including roads, coatings, 3D printing, coastal environmental protection, the steel and chemical industries, sewer rehabilitation and building radiation shielding and rocket launchpad and bunker infrastructure.
One of the earliest examples of a modern geopolymer concrete project was the Brisbane West Wellcamp airport in Australia.
It was built in 2014 with 70,000 metric tons of geopolymer concrete, which was estimated to have reduced the project’s carbon dioxide emissions by as much as 80%.
The geopolymer market is currently estimated to be between US$7 billion and $10 billion, with the largest growth in the Asia-Pacific region.
Analysts have estimated that the market could grow at a rate of 10% to 20% per year and reach about $62 billion by 2033.
In several countries, greenhouse gas regulations and green-building certifications are expected to support the continued growth of geopolymers in the construction industry.
Expanding the use of cement alternatives
The advantage of using industrial wastes in geopolymers is a double-edged sword, however. The composition of industrial wastes varies, so it can be difficult to standardize the processing methods. The geopolymer components need to be mixed in particular ratios to achieve desired properties.
Producing the activator for the geopolymer, typically done in chemical facilities, can raise the cost and contribute to the carbon footprint. And the long-term data about these materials’ stability is only now being developed given their newness. Also, these geopolymers can take longer to set than cement, though the setting time can be sped up by using raw materials that react quickly.
Developing cheaper, naturally available activators like agricultural waste rice husk with sustainable supply chains could help lower the costs and environmental impact. Also, printing the recipe on the raw material packaging could help simplify the job of determining the mixing ratio so geopolymers can be more widely used with confidence.
Even though geopolymer technology has some drawbacks, these low-carbon alternatives have great potential for reducing emissions from the construction sector.
Alcina Johnson Sudagar, Research Scientist in Chemistry, Washington University in St. Louis
This article is republished from The Conversation under a Creative Commons license. Read the original article.
📰 Enjoying STM Daily News? Join the conversation!
💬 Leave a comment, share your thoughts, and subscribe to our newsletter for the latest stories, updates, and “News You Can Use This Moment!” delivered to your inbox.
Stay connected with STM Daily News!