News
Atmospheric rivers are shifting poleward, reshaping global weather patterns


Zhe Li, University Corporation for Atmospheric Research
Atmospheric rivers – those long, narrow bands of water vapor in the sky that bring heavy rain and storms to the U.S. West Coast and many other regions – are shifting toward higher latitudes, and that’s changing weather patterns around the world.
The shift is worsening droughts in some regions, intensifying flooding in others, and putting water resources that many communities rely on at risk. When atmospheric rivers reach far northward into the Arctic, they can also melt sea ice, affecting the global climate.
In a new study published in Science Advances, University of California, Santa Barbara, climate scientist Qinghua Ding and I show that atmospheric rivers have shifted about 6 to 10 degrees toward the two poles over the past four decades.
Atmospheric rivers on the move
Atmospheric rivers aren’t just a U.S West Coast thing. They form in many parts of the world and provide over half of the mean annual runoff in these regions, including the U.S. Southeast coasts and West Coast, Southeast Asia, New Zealand, northern Spain, Portugal, the United Kingdom and south-central Chile.
California relies on atmospheric rivers for up to 50% of its yearly rainfall. A series of winter atmospheric rivers there can bring enough rain and snow to end a drought, as parts of the region saw in 2023.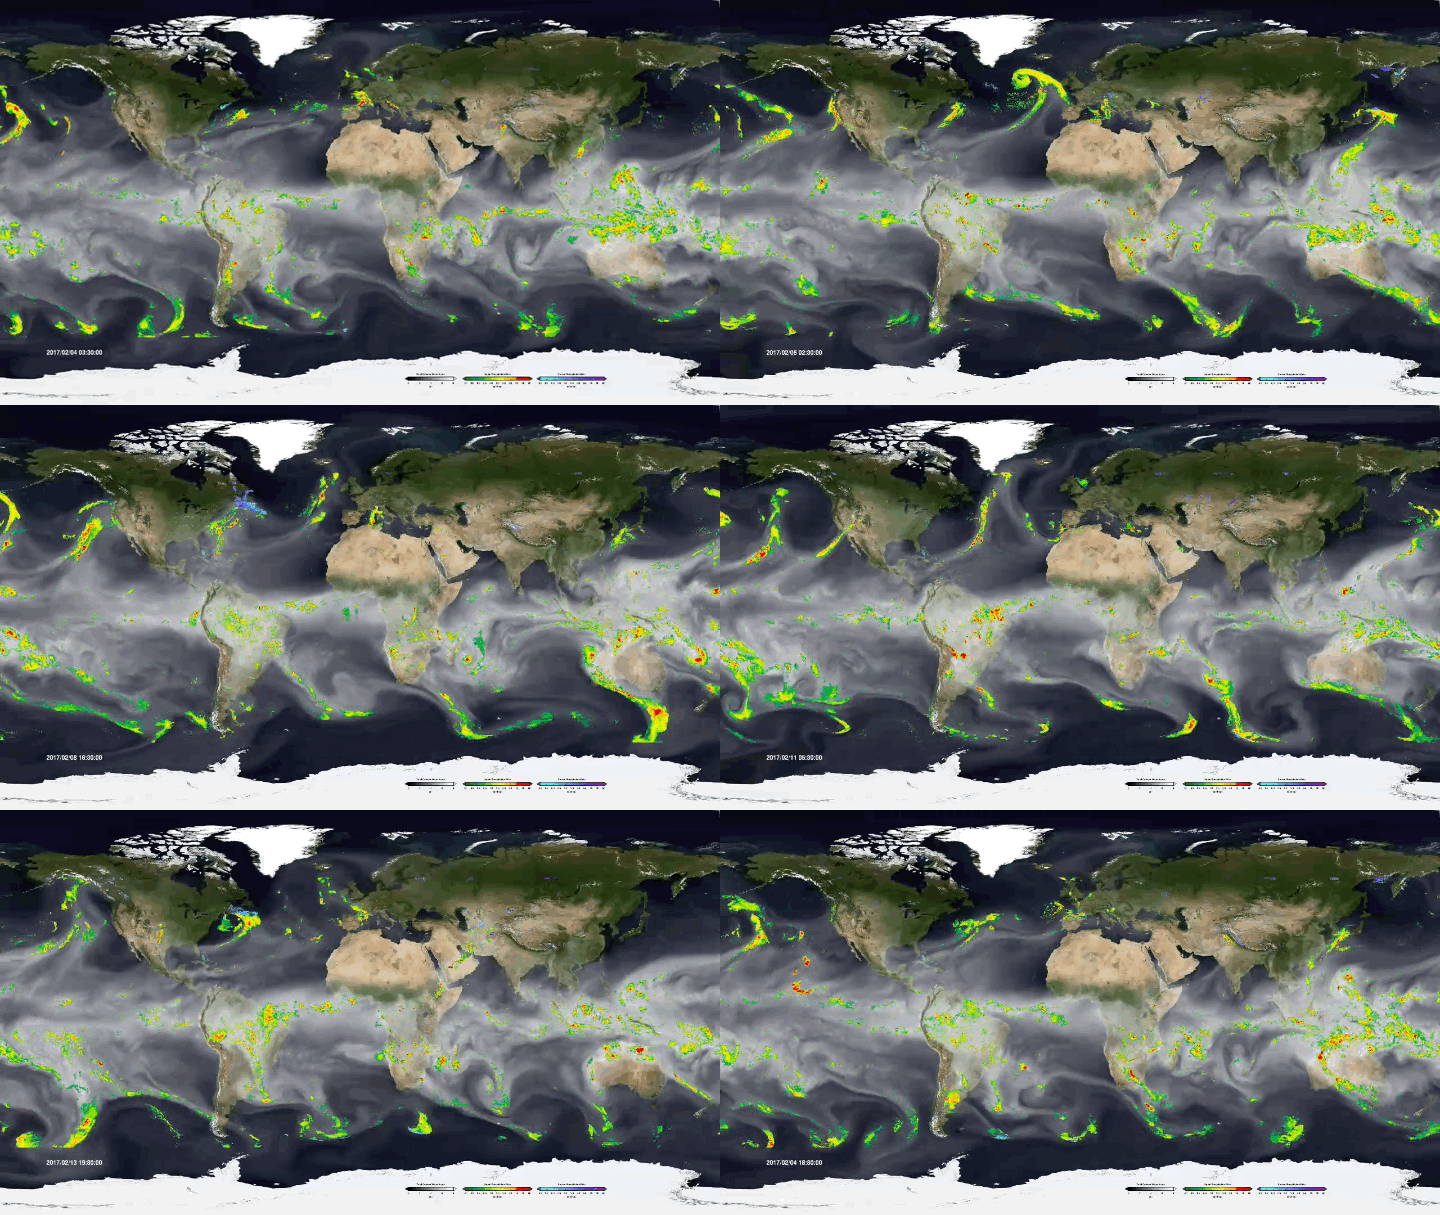
While atmospheric rivers share a similar origin – moisture supply from the tropics – atmospheric instability of the jet stream allows them to curve poleward in different ways. No two atmospheric rivers are exactly alike.
What particularly interests climate scientists, including us, is the collective behavior of atmospheric rivers. Atmospheric rivers are commonly seen in the extratropics, a region between the latitudes of 30 and 50 degrees in both hemispheres that includes most of the continental U.S., southern Australia and Chile.
Our study shows that atmospheric rivers have been shifting poleward over the past four decades. In both hemispheres, activity has increased along 50 degrees north and 50 degrees south, while it has decreased along 30 degrees north and 30 degrees south since 1979. In North America, that means more atmospheric rivers drenching British Columbia and Alaska.
A global chain reaction
One main reason for this shift is changes in sea surface temperatures in the eastern tropical Pacific. Since 2000, waters in the eastern tropical Pacific have had a cooling tendency, which affects atmospheric circulation worldwide. This cooling, often associated with La Niña conditions, pushes atmospheric rivers toward the poles.
The poleward movement of atmospheric rivers can be explained as a chain of interconnected processes.
During La Niña conditions, when sea surface temperatures cool in the eastern tropical Pacific, the Walker circulation – giant loops of air that affect precipitation as they rise and fall over different parts of the tropics – strengthens over the western Pacific. This stronger circulation causes the tropical rainfall belt to expand. The expanded tropical rainfall, combined with changes in atmospheric eddy patterns, results in high-pressure anomalies and wind patterns that steer atmospheric rivers farther poleward.
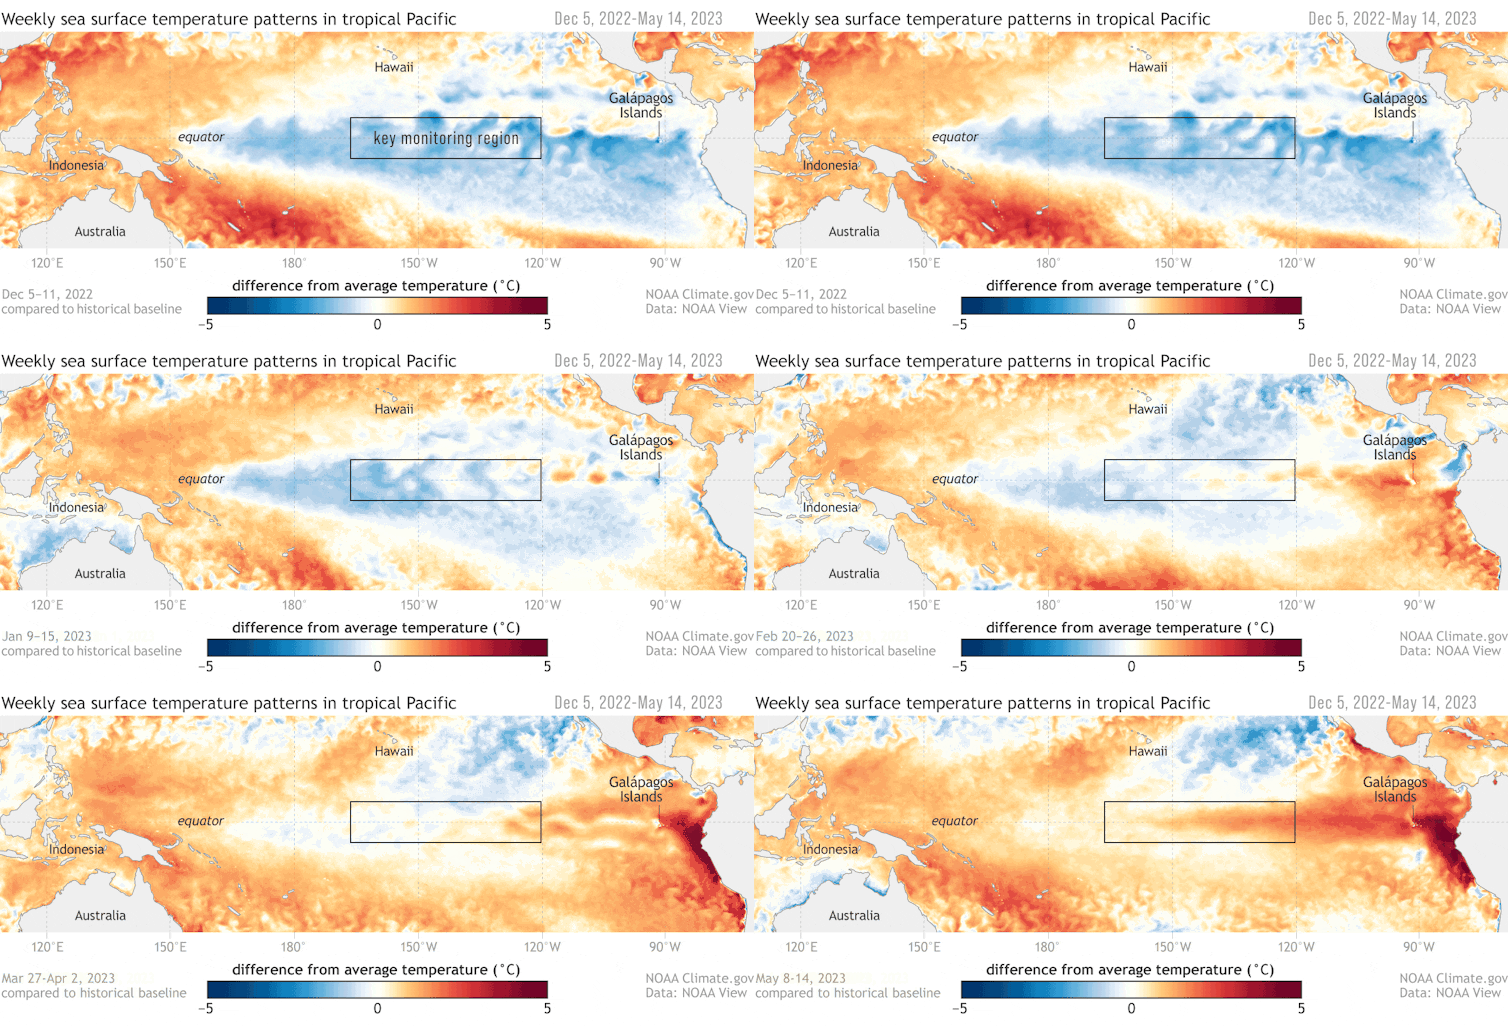
Conversely, during El Niño conditions, with warmer sea surface temperatures, the mechanism operates in the opposite direction, shifting atmospheric rivers so they don’t travel as far from the equator.
The shifts raise important questions about how climate models predict future changes in atmospheric rivers. Current models might underestimate natural variability, such as changes in the tropical Pacific, which can significantly affect atmospheric rivers. Understanding this connection can help forecasters make better predictions about future rainfall patterns and water availability.
Why does this poleward shift matter?
A shift in atmospheric rivers can have big effects on local climates.
In the subtropics, where atmospheric rivers are becoming less common, the result could be longer droughts and less water. Many areas, such as California and southern Brazil, depend on atmospheric rivers for rainfall to fill reservoirs and support farming. Without this moisture, these areas could face more water shortages, putting stress on communities, farms and ecosystems.
In higher latitudes, atmospheric rivers moving poleward could lead to more extreme rainfall, flooding and landslides in places such as the U.S. Pacific Northwest, Europe, and even in polar regions.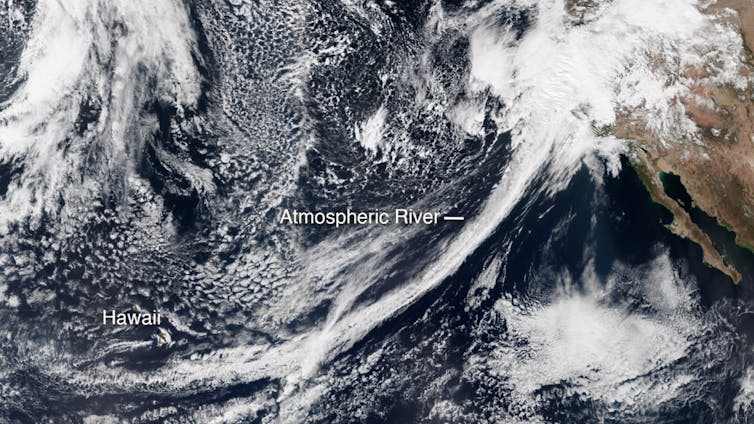
In the Arctic, more atmospheric rivers could speed up sea ice melting, adding to global warming and affecting animals that rely on the ice. An earlier study I was involved in found that the trend in summertime atmospheric river activity may contribute 36% of the increasing trend in summer moisture over the entire Arctic since 1979.
What it means for the future
So far, the shifts we have seen still mainly reflect changes due to natural processes, but human-induced global warming also plays a role. Global warming is expected to increase the overall frequency and intensity of atmospheric rivers because a warmer atmosphere can hold more moisture.
How that might change as the planet continues to warm is less clear. Predicting future changes remains uncertain due largely to the difficulty in predicting the natural swings between El Niño and La Niña, which play an important role in atmospheric river shifts.
As the world gets warmer, atmospheric rivers – and the critical rains they bring – will keep changing course. We need to understand and adapt to these changes so communities can keep thriving in a changing climate.
Zhe Li, Postdoctoral Researcher in Earth System Science, University Corporation for Atmospheric Research
This article is republished from The Conversation under a Creative Commons license. Read the original article.
The science section of our news blog STM Daily News provides readers with captivating and up-to-date information on the latest scientific discoveries, breakthroughs, and innovations across various fields. We offer engaging and accessible content, ensuring that readers with different levels of scientific knowledge can stay informed. Whether it’s exploring advancements in medicine, astronomy, technology, or environmental sciences, our science section strives to shed light on the intriguing world of scientific exploration and its profound impact on our daily lives. From thought-provoking articles to informative interviews with experts in the field, STM Daily News Science offers a harmonious blend of factual reporting, analysis, and exploration, making it a go-to source for science enthusiasts and curious minds alike. https://stmdailynews.com/category/science/


Daily News
Whose Debt Is the National Debt?
The national debt isn’t Americans’ credit card balances added together. This simple explainer separates federal borrowing from household debt and explains the difference between debt and a deficit.

Last Updated on October 11, 2026 by Daily News Staff
The Knowledge | STM Daily News
When you hear “national debt,” do you picture everyone’s credit card balances added together? The name can create that impression, but the national debt and household debt measure different borrowing.
The U.S. national debt is money the federal government owes. Your personal credit card balance is not included.
Federal debt versus household debt
The Treasury defines national debt as the federal government’s total outstanding borrowing accumulated over the country’s history. Household debt covers borrowing by individuals and families, including mortgages, credit cards, auto loans, and student loans.
|Type of debt |Who borrowed? |Examples |
|————–|————————|————————————————–|
|National debt |Federal government |Outstanding Treasury securities |
|Household debt|Individuals and families|Credit cards, mortgages, auto loans, student loans|
Putting a $500 purchase on your credit card increases your personal balance. It does not add $500 to the national debt.
How does the national debt grow?
When federal spending exceeds tax collections and other revenue, the government runs a budget deficit. Treasury sells securities to borrow money to cover the gap.
Consider a simplified, hypothetical example: the government collects $5 trillion and spends $6 trillion in one year. That leaves a $1 trillion deficit requiring financing.
A deficit measures a shortfall over a period, usually a year. Debt measures outstanding borrowing accumulated over time. Repeated deficits generally increase that debt. Interest on existing borrowing is also a federal expense.
Does paying off your credit card reduce the national debt?
Paying off a card reduces what you owe your lender. It does not directly repay Treasury borrowing. Household debt and government debt can influence the same economy, but they remain separate obligations.
When discussing debt, ask: Who borrowed the money? That one question helps distinguish a family’s finances from the federal budget.
Find more explanations of the ideas behind the headlines at STM Daily News, home of The Knowledge.
Sources
● U.S. Treasury: Understanding the National Debt
● U.S. Treasury: Understanding the National Deficit
● Federal Reserve Bank of New York: Household Debt and Credit Report

Science
October Meteor Showers Give Phoenix Skywatchers a Reason to Look Up
Phoenix skywatchers have several chances to catch October’s meteor showers. Here’s when to watch the Taurids and Orionids—and how moonlight affects the view.

Last Updated on October 10, 2026 by Daily News Staff
PHOENIX — October is bringing several opportunities to spot shooting stars over the Valley, with the Draconids reaching their October 8–9 peak and more meteor activity ahead.
The Draconids remain active through October 10, although viewers should expect a light display as the peak passes. Under favorable conditions, the shower typically produces only a handful of meteors per hour. timeanddate.com

Next, the Southern Taurids have an annual activity peak around October 14. Known for occasional bright fireballs, the shower continues into November. The stronger Orionids peak on the night of October 21 into the morning of October 22, typically producing 10–20 meteors per hour under dark skies. A bright Moon will interfere with this year’s display. American Meteor Society
The Orionids originate from debris left by Halley’s Comet. For Phoenix viewers, the best opportunity will be after moonset and before dawn, weather permitting. City lights will further reduce the number visible. amsmeteors.org
NASA recommends finding a viewing area away from streetlights, allowing about 30 minutes for eyes to adjust, and watching a broad stretch of sky. No telescope is needed—just a comfortable chair and patience. NASA Science
ECurious about what’s happening above us? Explore more space stories and science explainers in The Knowledge at STM Daily News.xplore more space, science and everyday

Local News
Maricopa Boil Water Advisory Lifted After Negative E. Coli Tests
Maricopa boil water advisory lifted: Global Water–Santa Cruz Water Company customers in Maricopa can resume normal tap water use after follow-up testing found no E. coli.
MARICOPA, Ariz. — A precautionary boil water advisory for Global Water–Santa Cruz Water Company customers in the city of Maricopa was lifted Thursday, October 8, after repeat testing found no E. coli in water samples. The utility announced the cancellation at approximately 2 p.m. Arizona time.

The advisory was issued October 7 after two preliminary tests indicated possible contamination. Customers were temporarily instructed to use bottled water or boil tap water for at least one minute before drinking it or using it for food preparation.
With follow-up results negative, affected customers no longer need to boil water for drinking, cooking, making ice, brushing teeth or washing dishes, according to the utility.
The advisory affected the utility’s customers in the city of Maricopa, located in Pinal County. It was not a countywide warning for Maricopa County or Phoenix.
Residents can visit Global Water Resources’ official notice page for updates or call 866-940-1102 with questions.