health and wellness
NIAAA: Deaths involving alcohol increased during the COVID-19 pandemic
The study showed a 22.4% increase in alcohol-related liver disease deaths, rising from 24,110 to 29,509, with the largest change seen in the 25-44 age group.

Last Updated on May 18, 2024 by Daily News Staff
BETHESDA /PRNewswire/ — Researchers at the National Institute on Alcohol Abuse and Alcoholism (NIAAA) used the national death certificate database to assess changes in alcohol-related deaths during the first year of the pandemic. The results, published in JAMA, show that after increasing around 2.2% per year over the previous two decades, deaths involving alcohol jumped 25.5% between 2019 to 2020, totaling 99,107 deaths.1
The study showed that alcohol-associated liver disease deaths increased 22.4% (from 24,110 to 29,509) with the largest change occurring among people ages 25 to 44. The number of deaths involving a combination of alcohol and opioids increased by 40.8% (from 8,503 to 11,969), with deaths involving alcohol and synthetic opioids (e.g., fentanyl) increasing by 59.2% (from 6,302 to 10,032).1
Reasons for the unprecedented increase in alcohol-related deaths during the first year of the pandemic are still being explored. In 2020, the first year of the pandemic, sales of alcohol increased by 2.9%, the largest annual increase in over 50 years.2 For those who were drinking more during the pandemic, research suggests that stress, anxiety, and previous alcohol misuse are contributing factors.3,4,5,6
The increase in alcohol-related deaths appears to reflect a widespread increase in alcohol consumption and related harms. For example, research suggests that increased alcohol consumption during the pandemic has been associated with negative health outcomes such as increases in transplants for alcohol-associated liver disease,7 emergency department visits for alcohol withdrawal,8 and the percentage of emergency department visits that involved acute alcohol consumption.9 Additionally, the National Highway Traffic Safety Administration reported a 14% increase in alcohol-related traffic fatalities in 2020 after decades of general decline.10
Researchers noted that deaths involving alcohol reflect hidden tolls of the pandemic. Increased drinking to cope with pandemic-related stressors, shifting alcohol policies, and disrupted treatment access are all possible contributing factors.
For more information, visit https://www.niaaa.nih.gov/
References:
1 White, A. M.; Castle, I. P.; Powell, P. A.; Hingson, R. W.; Koob, G. F. Alcohol-Related Deaths During the COVID-19 Pandemic. JAMA, 327(17), 1704–1706, 2022. PMID: 35302593
2 Slater, M.E.; Alpert, H.F. Surveillance Report #119: Apparent Per Capita Alcohol Consumption: National, State, and Regional Trends, 1977-2020. Sterling, VA: NIAAA, Division of Epidemiology and Prevention Research, April 2022. https://pubs.niaaa.nih.gov/publications/surveillance119/CONS20.htm . Accessed June 30, 2022.
3 Acuff, S. F.; Strickland, J. C.; Tucker, J. A.; Murphy, J. G. Changes in alcohol use during COVID-19 and associations with contextual and individual difference variables: A systematic review and meta-analysis. Psychology of addictive behaviors : journal of the Society of Psychologists in Addictive Behaviors, 36(1), 1–19, 2022. PMID: 34807630
4 Capasso, A.; Jones, A. M.; Ali, S. H.; et al. Increased alcohol use during the COVID-19 pandemic: The effect of mental health and age in a cross-sectional sample of social media users in the U.S. Preventive medicine, 145, 106422, 2021. PMID: 33422577
5 Grossman, E. R.; Benjamin-Neelon, S. E.; Sonnenschein, S. Alcohol Consumption during the COVID-19 Pandemic: A Cross-Sectional Survey of US Adults. International journal of environmental research and public health, 17(24), 9189, 2020. PMID: 33316978
6 Rodriguez, L. M.; Litt, D. M.; Stewart, S. H. Drinking to cope with the pandemic: The unique associations of COVID-19-related perceived threat and psychological distress to drinking behaviors in American men and women. Addictive behaviors, 110, 106532, 2020. PMID: 32652385
7 Cholankeril, G.; Goli, K.; Rana, A.; et al. Impact of COVID-19 Pandemic on Liver Transplantation and Alcohol-Associated Liver Disease in the USA. Hepatology (Baltimore, Md.), 74(6), 3316–3329, 2021. PMID: 34310738
8 Sharma, R. A.; Subedi, K.; Gbadebo, B. M.; et al. Alcohol Withdrawal Rates in Hospitalized Patients During the COVID-19 Pandemic. JAMA network open, 4(3), e210422, 2021. PMID: 33656526
9 Esser, M. B.; Idaikkadar, N.; Kite-Powell, A.; et al. Trends in emergency department visits related to acute alcohol consumption before and during the COVID-19 pandemic in the United States, 2018-2020. Drug and alcohol dependence reports, 3, 100049, 2022. PMID: 35368619
10 National Center for Statistics and Analysis, National Highway Traffic Safety Administration. Overview of Motor Vehicle Crashes in 2020. Washington, D.C.: U.S. Department of Transportation, 2019. https://crashstats.nhtsa.dot.gov/Api/Public/ViewPublication/813266. Accessed June 30, 2022.
SOURCE National Institute on Alcohol Abuse and Alcoholism
https://stmdailynews.com/category/entertainment/amusement-and-theme-parks


Lifestyle
How to Manage Symptoms of Heart Failure
Symptoms of Heart Failure: Managing heart failure is a significant expense to the U.S. healthcare system, costing the nation approximately $40 billion in 2020 and expected to increase to approximately $142 billion a year by 2050. If you (or a loved one) are living with the condition, consider these tips to help manage it.

How to Manage Symptoms of Heart Failure
(Feature Impact) Americans are facing a growing health challenge, with 1 in 4 adults at risk of heart failure, according to the Heart Failure Society of America. Additionally, approximately 6.7 million U.S. adults who are 20 years old or older are currently living with heart failure, and that number is projected to reach 8.7 million by 2030.
Managing heart failure is a significant expense to the U.S. healthcare system, costing the nation approximately $40 billion in 2020 and expected to increase to approximately $142 billion a year by 2050.
If you (or a loved one) are living with the condition, consider these tips to help manage it.
Adhere to the Treatment and Follow-Up Plan
Ongoing outpatient care is important when managing heart failure. Understand the treatment plan provided by your healthcare team, make diet and lifestyle changes, take medications as directed and keep recommended follow-up appointments.
Pay attention to changes in symptoms and communicate with your healthcare provider if treatment does not seem to be working as expected. If their conditions are left unmanaged, patients can experience a range of heart-failure-related symptoms such as shortness of breath, fatigue, buildup of fluid and more.
Understand Challenges with Diuretic Treatment
Diuretics help the body remove excess fluid and are commonly used to treat swelling, or edema, associated with heart failure. Your provider may try different diuretics, sometimes referred to as “water pills,” to manage your heart failure symptoms. However, intravenous (IV) diuretic therapy may be required for some patients if symptoms continue.
Ask About Treatment Options Before IV Care Is Needed
For some adults, a healthcare provider may consider recommending an at-home, non-oral diuretic option prior to escalating to IV therapy.
For example, ENBUMYST™ (bumetanide nasal spray) is a prescription diuretic used in adults to treat edema associated with congestive heart failure. It’s administered as a nasal spray for short-term use to manage excess fluid with the goal of transitioning to oral diuretic therapy when appropriate.
Talk with your healthcare provider to learn more and visit enbumyst.com. Read the full Prescribing Information and Patient Information.
Photo courtesy of Shutterstock
Important Safety Information
What is ENBUMYST?
ENBUMYST is a prescription medicine used in adults to treat swelling caused by excess fluid in the body (edema) from congestive heart failure, liver disease, and kidney disease.
What is the most important information I should know about ENBUMYST?
- ENBUMYST is a diuretic that helps your body remove fluid. Losing too much fluid can cause dehydration, low blood volume, and increase the risk of blood clots. Blood abnormalities may include decreased salts (electrolytes), and increased nitrogen, glucose and uric acid. The risk of these abnormalities is higher in elderly people, those using higher doses, or those who do not get enough electrolytes by mouth.
- You should not use ENBUMYST if you have severe electrolyte loss. Tell your healthcare provider if you experience unusual thirst; dizziness or lightheadedness; weakness or tiredness; fast heart rate; dry mouth or tongue; sudden pain; redness or swelling in your joints; pain, swelling, redness, or warmth in your leg; shortness of breath or fast breathing; high blood sugar; dark urine; pale, tight, cool or clammy skin; muscle cramps; confusion.
Do not use ENBUMYST if youhave low or no urine production or are allergic to bumetanide or to any of the ingredients in ENBUMYST.
Before using ENBUMYST, tell your healthcare provider if you have low electrolytes, are on a low-salt diet, have diarrhea, diabetes, nasal problems such as a runny or stuffy nose or polyps, a history of nasal injury or surgery, are or plan to become pregnant, are or plan to breastfeed.
Tell your healthcare provider about all the medicines you take, including prescriptions, over-the-counter medicines, vitamins, and herbal supplements.
ENBUMYST may cause serious side effects, such as worsening kidney function and ringing in the ears or hearing loss.
The most common side effects of ENBUMYST include dehydration, headache, muscle cramps, dizziness, low blood pressure, nausea, and abnormal brain functioning with certain liver problems.
These are not all the possible side effects of ENBUMYST. Talk to your healthcare provider for more information.
Call your healthcare provider for medical advice about side effects. You may report side effects to FDA at 1-800-FDA-1088.
US-ENBU-2600110

SOURCE:
Esperion
recipes
Keeping the Love of Food with Type 2 Diabetes
Living with Type 2 diabetes often means making adjustments to your daily routine, especially when it comes to food. Although adjusting to life with diabetes may take time, you don’t have to give up your favorite foods and flavors. In fact, it can be an opportunity to discover meals that support your health goals while still enjoying the foods you love.
(Feature Impact) Living with Type 2 diabetes often means making adjustments to your daily routine, especially when it comes to food. Whether you’re living with the condition or supporting someone who is, it can influence everything from meal planning to dinners out and everyday activities. Although adjusting to life with diabetes may take time, you don’t have to give up your favorite foods and flavors. In fact, it can be an opportunity to discover meals that support your health goals while still enjoying the foods you love.
That’s what professional chef and TV show host Kardea Brown did, alongside her husband Bryon Smith, who was recently diagnosed with Type 2 diabetes at age 38.
 “When my husband was diagnosed with Type 2 diabetes, it didn’t mean the end of the foods we love,” Brown said. “It meant I had to get creative. I started reimagining my recipes, so they still carry that same soul, that same comfort, just with ingredients that love him back a little better.”
To remove the guesswork about how certain ingredients affect Smith’s glucose levels, the couple relies on Abbott’s FreeStyle Libre 3 Plus sensor with Libre Assist*, a feature within the accompanying Libre app**. The technology provides real-time glucose insights and can help predict how certain foods may affect his glucose^ levels before a meal.
“I open the Libre Assist feature in the app, snap a photo and instantly see how that food might affect me before I even take the first bite,” Smith said. “It even suggests healthier swaps to help lower the impact.”
Small lifestyle changes can also make a difference in diabetes management. Brown recommends:
- Building balanced meals that prioritize non-starchy vegetables, lean proteins and healthy carbs for added fiber.
- Reading labels carefully to ensure you choose ingredients with little or no added sugars.
- Boosting fiber intake with ingredients like lentils, oats, beans and whole fruits.
- Cooking smarter at home by using simple methods like grilling, baking or sauteing with healthy fats, such as olive or canola oil.
- Planning and preparing for success by shopping with a list and planning meals in advance so you always have nutritious ingredients ready to cook.
To learn more about Libre Assist and to see if you qualify for a free† sensor, visit freestylelibre.us/LibreAssist.
The views expressed in this article should not be used for medical diagnosis or treatment or as a substitute for professional medical advice. Individual symptoms, situations and circumstances may vary.
* Libre Assist is a feature within Libre app that uses generative artificial intelligence to provide information on how foods could impact your glucose levels. Generative artificial intelligence may not always be accurate, and it should not be used to make treatment decisions.
** The FreeStyle Libre systems apps are only compatible with certain mobile devices and operating systems. Please check the Support section of our website for more information about device compatibility before using the apps. Use of the FreeStyle Libre systems apps may require registration with LibreView.
^Predicted glucose impact is based on user-provided food data and may differ from actual impact, which depends on sensor readings and factors like activity, stress, medication and alcohol. For personalized advice, consult your healthcare provider.
†Offer available for people who qualify. Visit MyFreeStyle.us to see all Terms and Conditions. Certain exclusions apply. Medicare and Medicaid patients are not eligible. See MyFreeStyle.us for more information.
Important Safety Information: Product for prescription only, for Important Safety Information visit FreeStyleLibre.us.
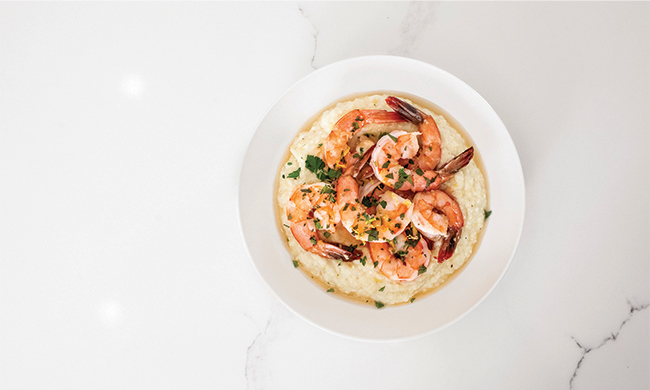
Shrimp Scampi and Cauliflower Grits
Recipe courtesy of Kardea Brown on behalf of Abbott
Prep time: 15 minutes
Cook time: 25 minutes
Servings: 4
Grits:
- 3 cups low-sodium chicken broth
- 1 cup light cream
- 1 cup stone-ground grits
- 1 cup cauliflower rice
- 2 tablespoons butter
- 1/2 cup shredded Parmesan cheese
- 1/4 teaspoon salt
- 1/4 teaspoon black pepper
Shrimp Scampi:
- 2 tablespoons butter
- 2 tablespoons olive oil
- 4 cloves garlic, minced
- 1/2 teaspoon red pepper flakes (optional)
- 1 pound large shrimp, peeled and deveined
- 1/2 cup low-sodium chicken broth
- 2 tablespoons dry white wine
- 1 lemon, juice only
- 1 teaspoon lemon zest
- salt, to taste
- pepper, to taste
- 2 tablespoons chopped parsley
- To make grits: Bring broth and cream to gentle boil; whisk in grits. Cook 10-15 minutes. Stir in cauliflower rice and cook 5-7 minutes. Add butter, cheese, salt and pepper.
- To make shrimp scampi: In pan, heat butter and oil; saute garlic and red pepper flakes, if desired, 30 seconds. Add shrimp, cook 1-2 minutes per side and remove.
- Add broth, wine, lemon juice and lemon zest; simmer 2-3 minutes. Return shrimp; toss; season with salt and pepper, to taste; and stir in parsley.
- Serve shrimp over creamy grits.

Macaroni and Cheese with Chickpea Pasta
Recipe courtesy of Kardea Brown on behalf of Abbott
Prep time: 20 minutes
Bake time: 30 minutes
Servings: 4-6
Pasta:
- 8 ounces chickpea-based, gluten-free pasta
Bechamel Sauce:
- 2 tablespoons butter
- 3 tablespoons almond flour
- 1 cup half-and-half
- 1/2 cup heavy cream
- 1/2 cup low-sodium chicken or vegetable broth
- 1 teaspoon Dijon mustard
- 1/4 teaspoon garlic powder
- 1/4 teaspoon smoked paprika
- salt, to taste
- black pepper, to taste
Cheese Blend:
- 1 cup medium cheddar cheese, shredded
- 1/2 cup Gruyere cheese, shredded
- 1/4 cup Parmesan cheese, grated
Topping:
- 1/2 cup shredded cheddar and Gruyere cheese
- 2 tablespoons almond flour (optional)
- chopped parsley
- Preheat oven to 375 F and grease baking dish.
- To make pasta: Cook pasta al dente.
- To make bechamel sauce: Melt butter and whisk in almond flour, 1-2 minutes. Slowly add half-and-half, heavy cream and broth. Stir until thickened. Season with mustard, garlic powder, smoked paprika and salt and pepper, to taste. Remove from heat.
- To make cheese blend: Mix cheddar, gruyere and Parmesan. Stir half the cheese blend into bechamel sauce until smooth. Stir in pasta.
- Layer pasta and cheese sauce in dish: half pasta, half cheese and repeat. Top with reserved cheese and almond flour, if desired.
- Cover with foil and bake 15-20 minutes. Remove foil and bake 10-15 minutes uncovered until golden.
- Rest 5 minutes, garnish with parsley and serve warm.

Red Velvet Layer Cake with Almond Flour
Recipe courtesy of Kardea Brown on behalf of Abbott
Prep time: 25 minutes
Bake time: 20 minutes
Chill time: 30-60 minutes
Servings: 12
Cake:
- 2 cups almond flour
- 1 cup whole-wheat pastry flour
- 1 tablespoon unsweetened cocoa powder
- 1 1/2 teaspoons baking powder
- 1/2 teaspoon baking soda
- 1/2 teaspoon salt
- 1 1/2 cups monk fruit-allulose blend
- 3 large eggs
- 1/2 cup plain unsweetened Greek yogurt
- 1/3 cup avocado oil
- 3/4 cup buttermilk
- 1 tablespoon distilled vinegar
- 2 teaspoons vanilla extract
- red food coloring (optional)
Whipped Cream:
- 6 ounces cream cheese, softened
- 1/3 cup powdered monk fruit
- 1 1/2 cups cold heavy whipping cream
Berry Drizzle:
- 1/2 cup no-sugar-added wild berry jam
- 1-2 tablespoons water
- 1 teaspoon lemon juice (optional)
Filling and Topping:
- 2 cups mixed berries (strawberries, blueberries, raspberries)
- Preheat oven to 350 F and grease or line three 8-inch pans.
- To make cake: In bowl, mix almond flour, pastry flour, cocoa powder, baking powder, baking soda, salt and monk fruit-allulose blend. In separate bowl, mix eggs, Greek yogurt, avocado oil, buttermilk, distilled vinegar, vanilla extract and red food coloring, if desired. Combine dry and wet ingredients until smooth. Divide evenly into pans and bake 18-22 minutes. Cool completely.
- To make whipped cream: Whip cream cheese and monk sugar until smooth. Add cream gradually and whip to medium-stiff peaks. Chill.
- To make berry drizzle: Warm berry jam with water and lemon juice, if desired, until pourable; cool slightly.
- To assemble cake: Layer cake, whipped cream, jam and berries; repeat for three layers. Top with berries and drizzle.
- Chill 30-60 minutes before slicing.
Photo courtesy of Abbott (Bryon Smith and Kardea Brown, a paid partner)
SOURCE:
Abbott
Health
When Vision Changes: 5 Ways to Navigate What Comes Next
Whether sight changes suddenly or gradually, a question often follows: “Now what?” There is no single way to adjust to vision loss, and the questions can change over time. These five starting points can help you identify what matters most now and where to find support.

(Feature Impact) A change in vision can turn ordinary routines into unfamiliar challenges. A favorite book becomes harder to read. Walking through a familiar neighborhood feels different. A family member offers help, but you may not know how to ask for what you need. Whether sight changes suddenly or gradually, a question often follows: “Now what?”
Medical care is essential, but many people encounter a Grand Canyon-sized gap between clinical care and everyday life with vision loss. Questions arise around getting around safely, continuing to do things you love, talking to family about what is changing and more. The answers take more than information; they require practical guidance, emotional support and connection with people who understand.
“The medical conversation rarely has room for what people are actually grappling with: fear, grief and the very practical question of how to keep living the lives they want,” said Johnjoe Farragher, CEO of Hadley, a nonprofit dedicated to helping adults with vision loss. “Those ‘now what?’ moments are where people need a clear place to begin.”
There is no single way to adjust to vision loss, and the questions can change over time. These five starting points can help you identify what matters most now and where to find support.
Take One Step at a Time
You don’t have to solve every challenge at once. Ask your vision care team about your diagnosis and treatment then think about what is most difficult in daily life right now. It could be reading email, moving safely through your home or using your phone. Choose one concern to address first. A small, useful change can make the next step feel more manageable.
 Make Room for the Emotional Side
Vision loss may bring grief, frustration, fear or a change in how you see yourself. Those feelings don’t have to be brushed aside before you can move forward. Share those feelings with someone you trust and seek professional support if you need it. Hearing how others navigated similar changes can help you feel less alone and identify possibilities you may not have imagined.
Find a Trusted Place to Begin
Ask your vision care team about support available in your community. If you’re unsure what to ask for, start with a specific daily challenge on your mind. Offering on-demand guidance, practical tools and opportunities to connect with others living with vision loss, Hadley focuses on life with vision loss beyond the doctor’s office. Its expert-informed guidance and community members address both practical problems and the emotions that come with them, shaped by lived experience. Support is available without cost or waitlists, whether you’re living with vision loss or helping someone you love.
Define Independence on Your Terms
Independence doesn’t have to mean doing everything alone. It may mean finding a new way to do something, choosing a tool that helps or telling family and friends exactly what assistance is useful. Think about a goal that matters to you, whether it’s getting around your home with more confidence or staying involved in a favorite activity, and build from there.
Keep Doing What Matters to You
A change in sight can change how you do things without ending your connection to the people and activities you love. The right adaptations depend on your vision, your interests and your goals.
For instance, when reading gets hard, magnifiers, enlarging fonts, access to free audiobooks and learning braille can make a difference. Passionate home chefs may use tactile or high-contrast labels, well-placed lighting, consistent organization or adaptive tools and techniques to keep cooking with confidence. Assistive technology, low-vision tools and simple adaptations can make everyday routines more accessible and help people stay connected to the activities and relationships that matter most.
When a new “now what?” question comes up, HadleyHelps.org offers a trusted place to start and a path forward.
Photos courtesy of Shutterstock
SOURCE: