financial wellness
More Americans Joining Workforce, But Many Are Unable to Find Living-Wage Jobs

Last Updated on September 19, 2025 by Daily News Staff
WASHINGTON, Sept. 15, 2022 /PRNewswire/ — The American workforce expanded from July to August, but many of those workers found they were unable to secure Living-Wage Jobs, according to an analysis by the Ludwig Institute for Shared Economic Prosperity (LISEP).
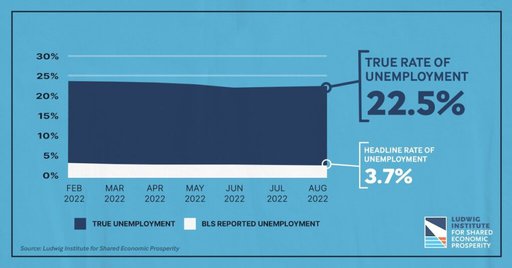
In its monthly True Rate of Unemployment (TRU) for August, LISEP reported that 22.5% of American workers are now classified as “functionally unemployed,” defined as the jobless, plus those seeking but unable to secure full-time employment, even if they want to work full-time and/or cannot earn above the poverty line after adjusting for inflation. This is an increase of 0.2 percentage points over the July TRU.
TRU’s sister metric, TRU Out of the Population (TRU OOP) – a measure of those who are functionally unemployed out of the entire population, not just active workforce participants – remained unchanged, which, when coupled with a rising TRU, indicates more workers are joining or returning to the labor force.
“It is a net positive that previously discouraged workers are rejoining the workforce, but unfortunately, their return to the workforce is, in many cases, not a return to full-time, living-wage employment,” said LISEP founder and chair Gene Ludwig. “The challenge for policymakers is to continue to encourage positive growth in employment opportunities, but do so in a manner that provides for growth in living-wage jobs for every American who wants one.”
Demographically, Black workers saw the biggest jump in TRU, increasing by 0.6 percentage points, from 25.8% to 26.4%. This, with the Black TRU OOP climbing by 0.7 percentage points, indicates that a larger percentage of Black workers are classified as functionally unemployed. Hispanic workers saw no change in the TRU, holding steady at 26.3%, with White workers tracking the overall TRU and increasing by 0.2 percentage points, to 20.7%. Male TRU increased a full percentage point, from 17.5% to 18.5%, while women dropped a half percentage point, from 27.5% to 27.0%.
Living-wage job opportunities continue to be an issue for workers with only a high school diploma, with the TRU for this group jumping 2.5 percentage points, from 24.5% to 27.0%. Likewise, those without a high school degree saw their TRU increase, from 47.3% to 47.6%. TRU for workers with some college (but no college degree) dropped, from 25.6% to 23.7%, but an analysis of the TRU OOP for this group indicates the decline is likely due to discouraged workers in this cohort leaving the workforce.
“We know the cost of living continues to be an issue for low- and middle-income Americans, as inflation continues to erode the ability of these workers to maintain even a basic standard of living. So in that respect, I’m somewhat relieved there wasn’t a bigger increase in the overall TRU,” Ludwig said. “But at the same time, we are witnessing an alarming decline in the opportunities for some minority workers to earn a living wage, which is undoubtedly a reason for concern. The bottom line: we can do better.”
About TRU
LISEP issued the white paper “Measuring Better: Development of ‘True Rate of Unemployment’ Data as the Basis for Social and Economic Policy” upon announcing the new statistical measure in October 2020. The paper and methodology can be viewed here. LISEP issues TRU one to two weeks following the release of the BLS unemployment report, which occurs on the first Friday of each month. The TRU rate and supporting data are available on the LISEP website at https://www.lisep.org/tru.
About LISEP
The Ludwig Institute for Shared Economic Prosperity (LISEP) was created in 2019 by Ludwig and his wife, Dr. Carol Ludwig. The mission of LISEP is to improve the economic well-being of middle- and lower-income Americans through research and education. LISEP’s original economic research includes new indicators for unemployment, earnings, and cost of living. These metrics aim to provide policymakers and the public with a more transparent view of the economic situation of all Americans, particularly low- and middle-income households, compared with misleading headline statistics.
About Gene Ludwig
In addition to his role as LISEP chair, Gene Ludwig is founder of the Promontory family of companies and Canapi LLC, a financial technology venture fund. He is the founder and CEO of Ludwig Regulatory Group (LRG), which advises financial firms on critical matters. Ludwig is the former vice chairman and senior control officer of Bankers Trust New York Corp. and served as the U.S. Comptroller of the Currency from 1993 to 1998. He is also author of the book The Vanishing American Dream, which investigates the economic challenges facing low- and middle-income Americans. On Twitter: @geneludwig.
SOURCE Ludwig Institute for Shared Economic Prosperity




financial wellness
Investing in Education: 5 Ways to Prepare Students for the Jobs of Tomorrow
Jobs of Tomorrow: A diploma is still an important milestone, but what matters more than the piece of paper is whether graduates have the knowledge, skills and confidence to take meaningful next steps in pursuing further education or building careers. Students, families, educators, employers and policymakers all have a role to play in cultivating these opportunities.

Investing in Education: 5 Ways to Prepare Students for the Jobs of Tomorrow
(Feature Impact) The landscape of modern work is changing rapidly, leaving many uncertain about whether they’re adequately equipped to face the future. Even though America invests roughly $1 trillion in education every year, it’s difficult to know whether that investment is truly preparing young people for what comes next.
“Our education system isn’t evolving quickly enough to prepare our students for the jobs of tomorrow,” said Amit Sevak, CEO of ETS, a global education and talent solutions organization working with more than 30 million students a year to measure learning success and power human progress at every stage of life. “Students only get one chance at an education, and we have a responsibility to understand what’s working, what’s not and where additional support is needed.”
A diploma is still an important milestone, but what matters more than the piece of paper is whether graduates have the knowledge, skills and confidence to take meaningful next steps in pursuing further education or building careers. Students, families, educators, employers and policymakers all have a role to play in cultivating these opportunities.
Start the Conversation Early
Success isn’t a single path anymore, so young people may benefit from thinking outside the traditional pipeline of high school to college to a good job to retirement. By prompting early conversations, parents can help their children begin sorting through their options well in advance. Encourage dinner table talks about favorite school subjects, what kind of work seems interesting and alternative pathways to build careers. The goal isn’t necessarily to choose a life track immediately – just to start exploring ideas before the time arrives to lock in a decision.
Learn to Work with AI
In the age of AI, there’s a balance to be found between fully embracing or avoiding it. Parents and educators can encourage thoughtful, responsible use of the AI tools reshaping modern workplaces – without sanctioning them as a way to get out of doing homework. Students should think critically about both the uses and limitations of AI, learning how these systems work but still recognizing when human judgment matters.
Get Real-World Experience Before Graduation
Textbooks and classrooms can teach a lot, but some of the most valuable lessons come from the real world. Summer jobs, internships, volunteering, co-op programs, job shadowing or small-scale forays into entrepreneurship can help kids discover where their talents and passions fit. It’s also a chance to develop the soft skills that make great employees, like being punctual, working well with others and adapting to new situations.
Build Human Skills
There are certain abilities technology just can’t replace, making them vital pieces of future-proof training. Strong communication, teamwork mindsets, critical thinking skills, civic reasoning and empathy translate well to many careers. Rather than focusing strictly on academics, teachers can shift lesson plans to encourage growth in these areas. Specialized hands-on talents and trades are also more insulated from technological disruptions.
Measure Progress Beyond Grades
Grades and test scores don’t tell the whole story about career readiness, yet they’re often treated as the only metric that matters in educational success. Policymakers have the opportunity to change how schools measure student progress, including by trading the one-size-fits-all rubrics for more personalized assessments that demonstrate proficiency in more comprehensive ways. Education is on the ballot this election season, so ask your local and state elected leaders about whether today’s graduates are ready to face the future.
For information about a system that gives students, educators and employers clear evidence that learning is leading to opportunity, visit ETS.org.
Photos courtesy of Shutterstock
SOURCE:
ETS
Lifestyle
7 Fire Prevention Tips to Protect Your Home and Community
7 Fire Prevention Tips: Fires can be devastating, but many of them are preventable with simple precautions and smart everyday choices. Consider these tips to reduce the risk of fires and keep your household, family and community safe.
7 Fire Prevention Tips to Protect Your Home and Community
(Feature Impact) In observance of National Fire Prevention Month, it’s a good time to review your fire safety habits at home and in your neighborhood. Fires can be devastating, but many of them are preventable with simple precautions and smart everyday choices.
Consider these tips to reduce the risk of fires and keep your household, family and community safe.
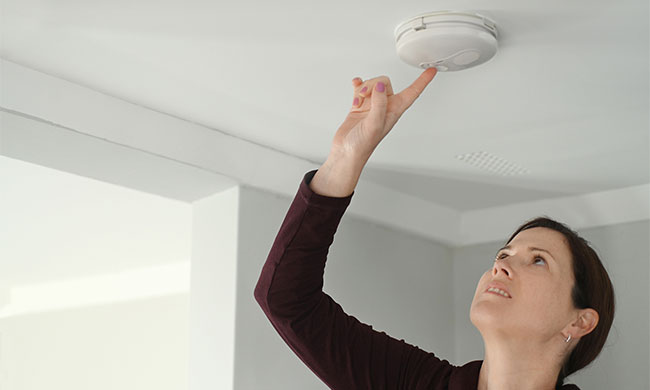
Test Your Smoke Alarms
Smoke detectors are one of the simplest yet most important tools for protecting your home, loudly alerting you to potential danger at any time of the day or night. Test them monthly, follow manufacturer’s instructions for replacement and change batteries as needed.
Heat Your Home Safely
Depending on how you heat your home, there can be different hazards to remain aware of. Never leave fireplaces unattended when in use and have them inspected and maintained as recommended by a trained professional. If you use portable heaters, keep them at least three feet away from curtains, bedding, furniture and other flammable materials.
Prevent Electrical Fires
Frayed cords, damaged outlets or overloaded appliances can pose real danger to your home when they overheat or spark. Particularly if you live in an older home or have outdated appliances, keep an eye out for warning signs like tripped circuit breakers, malfunctioning devices or the smell of burning. If you’re concerned, have your system inspected by a qualified electrician.
Store Flammable Objects Carefully
Keeping matches and lighters out of reach of children is always a smart first step for household fire safety. Also follow safe storage practices for items like lighter fluid, propane, aerosol cans and other household products that could potentially ignite when exposed to heat or a stray spark.
Practice Smart Kitchen and Grill Habits
From sparks flying off the grill to hot oil forgotten in the frying pan, cooking is the leading cause of household fires. Stay attentive in the kitchen, never leave cooking food unattended and avoid setting combustible materials like paper plates or fabric towels too close to a stove or grill. Also keep your appliances cleaned and well-maintained.
Plan Your Escape Route
Fires can spread quickly, which is why it’s important for everyone in your household to know the plan (and backup plan) for safely exiting different areas of the house during an emergency. Decide on a specific meeting place outside and practice quick fire drills together to build muscle memory.
Observe Local Fire Safety Rules
Where you live determines what kinds of fire risks affect your community, so make sure you stay informed about local regulations. For instance, areas prone to drought or wildfire may have rules about outdoor burning, and local fire prevention ordinances may outline specific requirements for smoke alarms in your home.
Find more home safety tips at eLivingtoday.com.
Photo courtesy of Shutterstock
SOURCE:
eLivingtoday.com
home improvement
5 Simple Steps to Prepare Before Disaster Strikes
Disaster preparedness doesn’t have to be expensive or complicated. It’s all about the small, simple steps you can take to protect yourself, your family and your community.
(Feature Impact) Disaster preparedness doesn’t have to be expensive or complicated. It’s all about the small, simple steps you can take to protect yourself, your family and your community.
Yet, as severe weather becomes more frequent, many people aren’t prepared for the impact.
New research from United Way Worldwide and Verizon revealed that although 60% of U.S. adults are concerned a natural disaster could affect their household in the next year, only 15% would feel very prepared for one.
While many people understand the risks, they face real barriers to preparation. Cost remains the primary obstacle to disaster preparedness with 45% of those surveyed naming it as the top barrier. In addition to cost, lack of time (25%) and not knowing where to start (28%) prevented people from taking action.
That’s why preparedness should be practical and affordable.
For example, the United Way’s United We Prepare initiative, supported by Verizon, offers free disaster preparedness workshops, emergency kit distribution, information on local emergency services and practical guidance to help people plan and be ready to weather a storm.
When individuals and families are better prepared, communities are more resilient. Get started with these simple, zero-cost steps:
 Identify Key Emergency Contacts
Choose a relative or friend outside of your immediate community who can act as a central check-in point or offer shelter during an emergency. Also, take a few moments to create updated digital and physical emergency contact lists with names, phone numbers and addresses of loved ones as well as service and healthcare providers.
Enable Local Alerts
Identify trusted local emergency services and news that can provide weather and emergency information. Turn on wireless emergency alerts in your phone settings, bookmark local news weather pages and save other important website links to ensure you’re in-the-know when disasters strike.
Build a Support System
Before severe weather, touch base with at least two neighbors or family members to identify what help they may need (or what assistance they can provide) and create a plan for checking in with each other in the event of an emergency.
Plan for Special Needs
It’s easiest to make clear-headed decisions before you’re stressed and rushing in the heat of the moment, so sit down and sketch out basic plans for special needs related to transportation, prescriptions, caregiving and pets before severe weather arrives. Decide where you would meet if separated, how to get there if transportation is disrupted, who would pick up children or take care of pets, what health needs or medications need to be considered and more.
Save Key Information and Documents Digitally
During a crisis, you likely won’t have time to search filing cabinets, desks and glove compartments for important documentation. Take photos or make digital copies of identification documents, insurance information, medical cards, prescription details, important household records and other key documents to access if you need to leave home quickly. For insurance purposes, it may also be helpful to take a video of your property and valuable belongings in your home in case they’re damaged or ruined.
The goal isn’t to do everything at once; it’s to start. An hour spent making connections, gathering information and talking through a plan today can make it easier to act when time matters most.
For more simple preparedness tips and resources, visit UnitedWePrepare.org.
Test Your Disaster Preparedness Knowledge
Take the quiz at UnitedWePrepare.org to test your knowledge on 10 disaster preparedness questions customized to your area, such as:
- What should you include in a winter emergency supply kit for your car?
- What is the difference between a Tornado Watch and Tornado Warning?
- When should you evacuate during a wildfire?
- Why is it important to prepare for disasters?
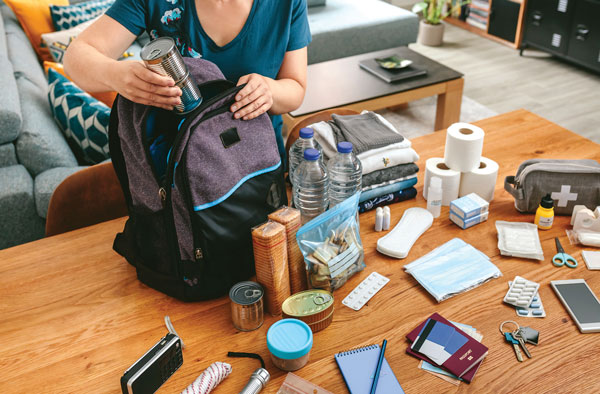
Photo courtesy of Shutterstock (preparation supplies)
SOURCE: