The Earth
The US natural gas industry is leaking way more methane than previously thought. Here’s why that matters
Research reveals that methane emissions from U.S. natural gas operations are significantly underestimated, with a leak rate of 2.3 percent, which poses serious climate concerns and challenges in accurate measurement.
Anthony J. Marchese, Colorado State University and Dan Zimmerle, Colorado State University
Natural gas is displacing coal, which could help fight climate change because burning it produces fewer carbon emissions. But producing and transporting natural gas releases methane, a greenhouse gas that also contributes to climate change. How big is the methane problem?
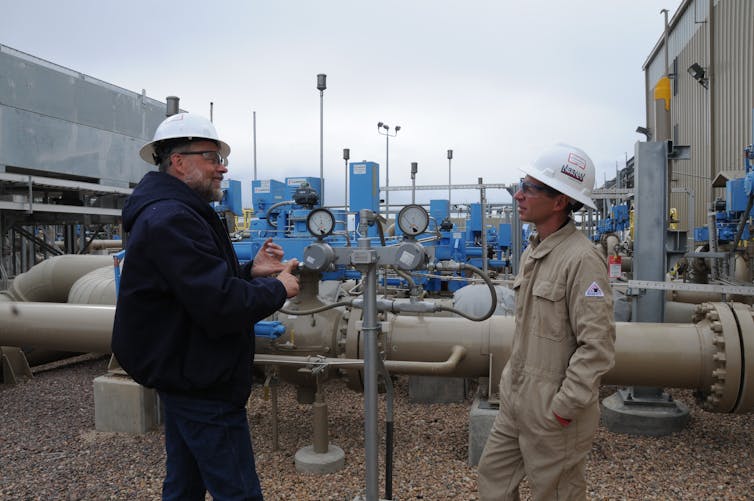
For the past five years, our research teams at Colorado State University have made thousands of methane emissions measurements at more than 700 separate facilities in the production, gathering, processing, transmission and storage segments of the natural gas supply chain.
This experience has given us a unique perspective regarding the major sources of methane emissions from natural gas and the challenges the industry faces in terms of detecting and reducing, if not eliminating, them.
Our work, along with numerous other research projects, was recently folded into a new study published in the journal Science. This comprehensive snapshot suggests that methane emissions from oil and gas operations are much higher than current EPA estimates.
What’s wrong with methane
One way to quantify the magnitude of the methane leakage is to divide the amount of methane emitted each year by the total amount of methane pumped out of the ground each year from natural gas and oil wells. The EPA currently estimates this methane leak rate to be 1.4 percent. That is, for every cubic foot of natural gas drawn from underground reservoirs, 1.4 percent of it is lost into the atmosphere.
This study synthesized the results from a five-year series of 16 studies coordinated by environmental advocacy group Environmental Defense Fund (EDF), which involved more than 140 researchers from over 40 institutions and 50 natural gas companies.
The effort brought together scholars based at universities, think tanks and the industry itself to make the most accurate estimate possible of the total amount of methane emitted from all U.S. oil and gas operations. It integrated data from a multitude of recent studies with measurements made on the ground and from the air.
All told, based on the results of the new study, the U.S. oil and gas industry is leaking 13 million metric tons of methane each year, which means the methane leak rate is 2.3 percent. This 60 percent difference between our new estimate and the EPA’s current one can have profound climate consequences.
Methane is a highly potent greenhouse gas, with more than 80 times the climate warming impact of carbon dioxide over the first 20 years after it is released.
An earlier EDF study showed that a methane leak rate of greater than 3 percent would result in no immediate climate benefits from retiring coal-fired power plants in favor of natural gas power plants.
That means even with a 2.3 percent leakage rate, the growing share of U.S. electricity powered by natural gas is doing something to slow the pace of climate change. However, these climate benefits could be far greater.
Also, at a methane leakage rate of 2.3 percent, many other uses of natural gas besides generating electricity are conclusively detrimental for the climate. For example, EDF found that replacing the diesel used in most trucks or the gasoline consumed by most cars with natural gas would require a leakage rate of less than 1.4 percent before there would be any immediate climate benefit.
What’s more, some scientists believe that the leakage rate could be even higher than this new estimate.
What causes these leaks
Perhaps you’ve never contemplated the long journey that natural gas travels before you can ignite the burners on the gas stove in your kitchen.
But on top of the 500,000 natural gas wells operating in the U.S. today, there are 2 million miles of pipes and millions of valves, fittings, tanks, compressors and other components operating 24 hours per day, seven days a week to deliver natural gas to your home.
That natural gas that you burn when you whip up a batch of pancakes may have traveled 1,000 miles or more as it wended through this complicated network. Along the way, there were ample opportunities for some of it to leak out into the atmosphere.
Natural gas leaks can be accidental, caused by malfunctioning equipment, but a lot of natural gas is also released intentionally to perform process operations such as opening and closing valves. In addition, the tens of thousands of compressors that increase the pressure and pump the gas along through the network are powered by engines that burn natural gas and their exhaust contains some unburned natural gas.
Since the natural gas delivered to your home is 85 to 95 percent methane, natural gas leaks are predominantly methane. While methane poses the greatest threat to the climate because of its greenhouse gas potency, natural gas contains other hydrocarbons that can degrade regional air quality and are bad for human health.
Inventory tallies vs. aircraft surveillance
The EPA Greenhouse Gas Inventory is done in a way experts like us call a “bottom-up” approach. It entails tallying up all of the nation’s natural gas equipment – from household gas meters to wellpads – and estimating an annualized average emission rate for every category and adding it all up.
There are two challenges to this approach. First, there are no accurate equipment records for many of these categories. Second, when components operate improperly or fail, emissions balloon, making it hard to develop an accurate and meaningful annualized emission rate for each source.
“Top-down” approaches, typically requiring aircraft, are the alternative. They measure methane concentrations upwind and downwind of large geographic areas. But this approach has its own shortcomings.
First, it captures all methane emissions, rather than just the emissions tied to natural gas operations – including the methane from landfills, cows and even the leaves rotting in your backyard. Second, these one-time snapshots may get distorted depending on what’s going on while planes fly around capturing methane data.
Historically, top-down approaches estimate emissions that are about twice bottom-up estimates. Some regional top-down methane leak rate estimates have been as high as 8 percent while some bottom-up estimates have been as low as 1 percent.
More recent work, including the Science study, have performed coordinated campaigns in which the on-the-ground and aircraft measurements are made concurrently, while carefully modeling emission events.
Helpful gadgets and sound policy
On a sunny morning in October 2013, our research team pulled up to a natural gas gathering compressor station in Texas. Using an US$80,000 infrared camera, we immediately located an extraordinarily large leak of colorless, odorless methane that was invisible to the operator who quickly isolated and fixed the problem.
We then witnessed the methane emissions decline tenfold – the facility leak rate fell from 9.8 percent to 0.7 percent before our eyes.
It is not economically feasible, of course, to equip all natural gas workers with $80,000 cameras, or to hire the drivers required to monitor every wellpad on a daily basis when there are 40,000 oil and gas wells in Weld County, Colorado, alone.
But new technologies can make a difference. Our team at Colorado State University is working with the Department of Energy to evaluate gadgetry that will rapidly detect methane emissions. Some of these devices can be deployed today, including inexpensive sensors that can be monitored remotely.
Technology alone won’t solve the problem, however. We believe that slashing the nation’s methane leak rate will require a collaborative effort between industry and government. And based on our experience in Colorado, which has developed some of the nation’s strictest methane emissions regulations, we find that best practices become standard practices with strong regulations.
We believe that the Trump administration’s efforts to roll back regulations, without regard to whether they are working or not, will not only have profound climate impacts. They will also jeopardize the health and safety of all Americans while undercutting efforts by the natural gas industry to cut back on the pollution it produces.
Anthony J. Marchese, Associate Dean for Academic and Student Affairs, Walter Scott, Jr. College of Engineering; Director, Engines and Energy Conversion Laboratory; Professor, Department of Mechanical Engineering, Colorado State University and Dan Zimmerle, Senior Research Associate and Director of METEC, Colorado State University
This article is republished from The Conversation under a Creative Commons license. Read the original article.

The Earth
PFAS are turning up in the Great Lakes, putting fish and water supplies at risk – here’s how they get there
PFAS “forever chemicals” are entering the Great Lakes through rivers, groundwater, and rain, threatening drinking water, fish, and one of the world’s largest freshwater systems.
Christy Remucal, University of Wisconsin-Madison
No matter where you live in the United States, you have likely seen headlines about PFAS being detected in everything from drinking water to fish to milk to human bodies.
PFAS, or per- and polyfluoroalkyl substances, are a group of over 10,000 synthetic chemicals. They have been used for decades to make products waterproof and stain- and heat-resistant – picture food wrappers, stain-resistant carpet, rain jackets and firefighting foam.
These chemicals are a growing concern because some PFAS are toxic even at very low levels and associated with health risks like thyroid issues and cancer. And some of the most common PFAS don’t naturally break down, which is why they are often referred to as “forever chemicals.”
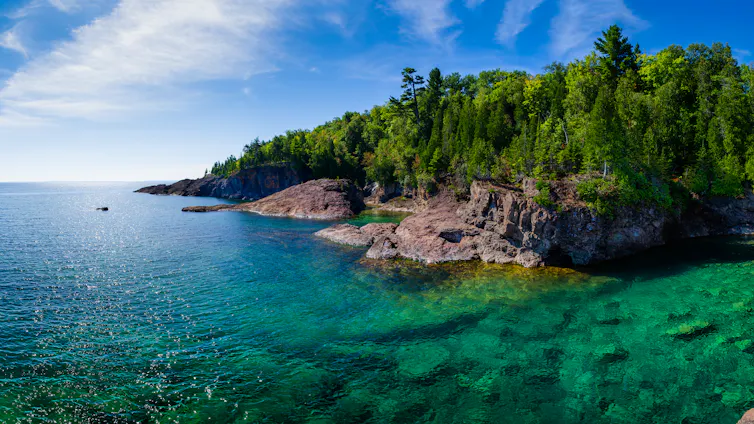
Now, PFAS are posing a threat to the Great Lakes, one of America’s most vital water resources.
The five Great Lakes are massive, with over 10,000 miles of coastline (16,000 kilometers) across two countries and containing 21% of the world’s fresh surface water. They provide drinking water to over 30 million people and are home to a robust commercial and recreational fishing industry.
My colleagues at the University of Wisconsin-Madison and I study how chemicals like PFAS are affecting water systems. Here’s what we’re learning about how PFAS are getting into the Great Lakes, the risks they’re posing and how to reduce those risks in the future.
PFAS’ many pathways into the Great Lakes
Hundreds of rivers flow into the lakes, and each can be contaminated with PFAS from sources such as industrial sites, military operations and wastewater treatment plants in their watersheds. Some pesticides also contain PFAS, which can wash off farm fields and into creeks, rivers and lakes.
The concentration of PFAS in rivers can vary widely depending on these upstream impacts. For example, we found concentrations of over 1,700 parts-per-trillion in Great Lakes tributaries in Wisconsin near where firefighting foam has regularly been used. That’s more than 400 times higher than federal drinking water regulations for PFOS and PFOA, both 4 parts-per-trillion.
However, concentration alone does not tell the whole story. We also found that large rivers with relatively low amounts of PFAS can put more of these chemicals into the lakes each day compared with smaller rivers with high amounts of PFAS. This means that any effort to limit the amount of PFAS in the Great Lakes should consider both high-concentration hot spots and large rivers.
Groundwater is another key route carrying PFAS into the Great Lakes. Groundwater is a drinking water source for more than one-third of people in the U.S., and it can become contaminated when PFAS in firefighting foam and other PFAS sources seep into soil.
When these contaminated plumes enter the Great Lakes, they carry PFAS with them. We detected PFAS concentrations of over 260 parts-per-trillion in the bay of Green Bay in Lake Michigan. The chemicals we found were associated with firefighting foam, and we were able to trace them back to a contaminated groundwater plume.
PFAS can also enter the Great Lakes in unexpected ways, such as in rain and snowfall. PFAS can get into the atmosphere from industrial processes and waste incineration. The chemicals have been detected in rain across the world, including in states surrounding the Great Lakes.
Although PFAS concentrations in precipitation are typically lower than in rivers or groundwater, this is still an important contamination source. Scientists estimate that precipitation is a major source of PFAS to Lake Superior, which receives about half of its water through precipitation.
Where PFAS end up determines the risk
Much of the PFAS that enter Lake Superior will eventually make their way to the downstream lakes of Michigan, Huron, Erie and Ontario.
These chemicals’ ability to travel with water is one reason why PFAS are such a concern for drinking water systems. Many communities get their drinking water from the Great Lakes.
https://datawrapper.dwcdn.net/ovIHR/1
PFAS can also contaminate other parts of the environment.
The chemicals have been detected in sediments at the bottom of all the Great Lakes. Contaminated sediment can release PFAS back into the overlying water, where fish and aquatic birds can ingest it. So, future remediation efforts to remove PFAS from the lakes are about more than just the water – they involve the sediment as well.
PFAS can also accumulate in foams that form on lake shorelines during turbulent conditions. Concentrations of PFAS can be up to 7,000 times higher in natural foams compared with the water because PFAS are surfactants and build up where air and water meet, like bubbles in foam. As a result, state agencies recommend washing skin that comes in contact with foam and preventing pets from playing in foam.
Some PFAS bioaccumulate, or build up, within fish and wildlife. Elevated levels of PFAS have been detected in Great Lakes fish, raising concerns for fisheries.
High PFAS concentrations in fish in coastal areas and inland waters have led to advisories recommending people limit how much they fish they eat.
Looking ahead
Water cycles through the Great Lakes, but the process can take many years, from 2.6 years in Lake Erie to nearly 200 years in Lake Superior.
This means that PFAS that enter the lakes will be there for a very long time.
https://datawrapper.dwcdn.net/OOPxB/1
Since it is not possible to clean up the over 6 quadrillion gallons of water in the Great Lakes after they have been contaminated, preventing further contamination is key to protecting the lakes for the future.
That starts with identifying contaminated groundwater and rivers that are adding PFAS to the lakes. The Sea Grant College Program and the National Institutes of Water Resources, including the Wisconsin programs that I direct, have been supporting research to map these sources, as well as helping translate that knowledge into actions that policymakers and resource managers can take.
PFAS contamination is an issue beyond the Great Lakes and is something everyone can work to address.
- Drinking water. If you are one of the millions of people who drink water from the Great Lakes, find out the PFAS concentrations in your drinking water. This data is increasingly available from local drinking water utilities.
- Fish. Eating fish can provide great health benefits, but be aware of health advisories about fish caught in the Great Lakes and in inland waters so you can balance the risks. Other chemicals, such as mercury and PCBs, can also lead to fish advisories.
- Personal choice. Scientists have proposed that PFAS only be used when they have vital functions and there are no alternatives. Consumer demand for PFAS-free products is helping reduce PFAS use in some products. Several states have also introduced legislation to ban PFAS use in some applications.
Decreasing use of PFAS will ultimately prevent downstream contamination in the Great Lakes and around the U.S.
Christy Remucal, Professor of Civil and Environmental Engineering, University of Wisconsin-Madison
This article is republished from The Conversation under a Creative Commons license. Read the original article.
Dive into “The Knowledge,” where curiosity meets clarity. This playlist, in collaboration with STMDailyNews.com, is designed for viewers who value historical accuracy and insightful learning. Our short videos, ranging from 30 seconds to a minute and a half, make complex subjects easy to grasp in no time. Covering everything from historical events to contemporary processes and entertainment, “The Knowledge” bridges the past with the present. In a world where information is abundant yet often misused, our series aims to guide you through the noise, preserving vital knowledge and truths that shape our lives today. Perfect for curious minds eager to discover the ‘why’ and ‘how’ of everything around us. Subscribe and join in as we explore the facts that matter. https://stmdailynews.com/the-knowledge/
Science
Saltwater flooding is a serious fire threat for EVs and other devices with lithium-ion batteries
Last Updated on March 15, 2026 by Daily News Staff
Xinyu Huang, University of South Carolina
Flooding from hurricanes Helene and Milton inflicted billions of dollars in damage across the Southeast in September and October 2024, pushing buildings off their foundations and undercutting roads and bridges. It also caused dozens of electric vehicles and other battery-powered objects, such as scooters and golf carts, to catch fire.
According to one tally, 11 electric cars and 48 lithium-ion batteries caught fire after exposure to salty floodwater from Helene. In some cases, these fires spread to homes.
When a lithium-ion battery pack bursts into flames, it releases toxic fumes, burns violently and is extremely hard to put out. Frequently, firefighters’ only option is to let it burn out by itself.
Particularly when these batteries are soaked in saltwater, they can become “ticking time bombs,” in the words of Florida State Fire Marshall Jimmy Patronis. That’s because the fire doesn’t always occur immediately when the battery is flooded. According to the National Highway Traffic Safety Administration, about 36 EVs flooded by Hurricane Ian in Florida in 2022 caught fire, including several that were being towed after the storm on flatbed trailers.
Many consumers are unaware of this risk, and lithium-ion batteries are widely used in EVs and hybrid cars, e-bikes and scooters, electric lawnmowers and cordless power tools.
I’m a mechanical engineer and am working to help solve battery safety issues for our increasingly electrified society. Here’s what all owners should know about water and the risk of battery fires: https://www.youtube.com/embed/gWkEGEbpqFc?wmode=transparent&start=10 Emergency responders handle EVs that were immersed in saltwater during Hurricane Ian in Florida in 2022, including some that ignited.
The threat of saltwater
The trigger for lithium-ion battery fires is a process called thermal runaway – a cascading sequence of heat-releasing reactions inside the battery cell.
Under normal operating conditions, the probability of a lithium-ion cell going into thermal runaway is less than 1 in 10 million. But it increases sharply if the cell is subjected to electrical, thermal or mechanical stress, such as short-circuiting, overheating or puncture.
Saltwater is a particular problem for batteries because salt dissolved in water is conductive, which means that electric current readily flows through it. Pure water is not very conductive, but the electrical conductivity of seawater can be more than a thousand times higher than that of fresh water.
All EV battery pack enclosures use gaskets to seal off their internal space from the elements outside. Typically, they have waterproof ratings of IP66 or IP67. While these ratings are high, they do not guarantee that a battery will be watertight when it is immersed for a long period of time – say, over 30 minutes.
Battery packs also have various ports to equalize pressure inside the battery and move electrical power in and out. These can be potential pathways for water to leak into the pack enclosure. Inadequate seal ratings and manufacturing defects can also enable water to find its way into the battery pack if it is immersed.
How water leads to fire
All batteries have two terminals: One is marked positive (+), and the other is marked negative (-). When the terminals are connected to a device that uses electricity to do work, such as a light bulb, chemical reactions occur inside the battery that cause electrons to flow from the negative to the positive terminal. This creates an electric current and releases the energy stored in the battery.
Electrons flow between a battery’s terminals because the chemical reactions inside the battery create different electrical potentials between the two terminals. This difference is also known as voltage. When saltwater comes into contact with metal battery terminals with different electrical potentials, the battery can short-circuit, inducing rapid corrosion and electric arcing, and generating excessive current and heat. The more conductive the liquid is that penetrates the battery pack, the higher the shorting current and rate of corrosion.
Rapid corrosion reactions within the battery pack produce hydrogen and oxygen, corroding away materials from metallic terminals on the positive side of the battery and depositing them onto the negative side. Even after the water drains away, these deposited materials can form solid shorting bridges that remain inside the battery pack, causing a delayed thermal runaway. A fire can start days after the battery is flooded.
Even a battery pack that is fully discharged isn’t necessarily safe during flooding. A lithium-ion cell, even at 0% state of charge, still has about a three-volt potential difference between its positive and negative terminals, so some current can flow between them. For a battery string with many cells in a series – a typical configuration in electric cars – residual voltage can still be high enough to drive these reactions.
Many scientists, including me and my colleagues, are working to understand the exact sequence of events that can occur in a battery pack after it is exposed to saltwater and lead to thermal runaway. We also are looking for ways to help reduce fire risks from flooded battery packs.
These could include finding better ways to seal the battery packs; using alternative, more corrosion-resistant materials for the battery terminals; and applying waterproof coatings to exposed terminals inside the battery pack.
What EV owners should know
Electric cars are still very safe to drive and own in most circumstances. However, during extreme situations like hurricanes and flooding, it is very important to keep EV battery packs from becoming submerged in water, particularly saltwater. The same is true for other products that contain lithium-ion batteries.
For EVs, this means evacuating cars out of the affected zone or parking them on high ground before flooding occurs. Smaller objects, like e-bikes and power tools, can be moved to upper floors of buildings or stored on high shelves.
If you own an EV that has been submerged in water for hours to days, particularly in saltwater, public safety experts recommend treating it as a fire hazard and placing it on open ground away from other valuable property. Do not attempt to charge or operate it. Contact the manufacturer for an inspection to assess battery damage.
Often, a flooded electric vehicle will need to be towed away for further inspection. However, since thermal runaway can occur well after submersion, the car should not be moved until it has been professionally assessed.
Xinyu Huang, Associate Professor of Mechanical Engineering, University of South Carolina
This article is republished from The Conversation under a Creative Commons license. Read the original article.
The science section of our news blog STM Daily News provides readers with captivating and up-to-date information on the latest scientific discoveries, breakthroughs, and innovations across various fields. We offer engaging and accessible content, ensuring that readers with different levels of scientific knowledge can stay informed. Whether it’s exploring advancements in medicine, astronomy, technology, or environmental sciences, our science section strives to shed light on the intriguing world of scientific exploration and its profound impact on our daily lives. From thought-provoking articles to informative interviews with experts in the field, STM Daily News Science offers a harmonious blend of factual reporting, analysis, and exploration, making it a go-to source for science enthusiasts and curious minds alike. https://stmdailynews.com/category/science/
The Knowledge
2025 was hotter than it should have been – 5 influences and a dirty surprise offer clues to what’s ahead
The past three years recorded unprecedented global heat, with 2025 being particularly warm. Factors such as greenhouse gas emissions and a decline in solar activity influenced temperatures and extreme weather patterns.

Michael Wysession, Washington University in St. Louis
The past three years have been the world’s hottest on record by far, with 2025 almost tied with 2023 for second place. With that energy came extreme weather, from flash flooding to powerful hurricanes and severe droughts. Yet, by most indicators, the planet should have been cooler in 2025 than it was.
So, what happened, and what does that say about the year ahead?
As an earth and environmental scientist, I study influences that affect global temperatures year to year, such as El Niño, wildfires and solar cycles. Some make Earth hotter. Some make it cooler. And one particularly unhealthy influence has been quietly hiding a large amount of global warming – until now.
Factors that made 2025 cooler than 2024
The Earth’s climate is the result of many factors that change from year to year. Some that helped make 2025 cooler than 2024 include:
La Niña’s arrival: La Niña is part of the El Niño-Southern Oscillation, a natural climate pattern that fluctuates between warm El Niño conditions and cooler La Niña conditions. During El Niño, the Pacific Ocean heats up along the equator, influencing the atmosphere in ways that can cause intense storms, droughts and heat waves around the planet. La Niña does the opposite; it’s like putting an ice pack on the atmosphere.
Both 2023 and 2024 were El Niño years, but in 2025 conditions shifted to neutral and then to La Niña starting in September.
The solar cycle: The Sun reached its solar maximum near the end of 2024, the peak of its energy output in an approximately 11-year cycle, and began declining in 2025. So, while the sun’s output was still stronger than average in 2025, it was less than in 2024.
Fewer wildfires: Despite some destructive blazes, the world also saw fewer wildfires during 2025 than 2024, which put less carbon dioxide – a planet-warming greenhouse gas – into the atmosphere.
Despite those points, 2025 still ended up as the third-hottest year in over 175 years of record-keeping and likely one of the warmest in at least several thousand years. It was nearly as warm as 2023, at 2.6 degrees Fahrenheit (1.47 Celsius) above the 1850-1900 average, according to the European Union’s Copernicus Climate Change Service. It also had the second-highest average land temperature recorded, up 3.6 F (2 C) compared to preindustrial years, with more than 10% of the land experiencing record-high temperatures.
Factors that made 2025 warmer than expected
Several other factors made 2025 warmer than expected, and some are likely to continue to increase in 2026. They include:
Greenhouse gas emissions: The big driver of global warming is excess greenhouse gas emissions, largely from burning fossil fuels, and 2025 had plenty.
Greenhouse gases trap heat near Earth’s surface like a blanket, raising the temperature. They also linger in the atmosphere for years to centuries, meaning gases released today will continue to warm the planet well into the future. The levels of carbon dioxide, methane and nitrous oxide in the atmosphere all increased in 2025.

Rising energy demand drove an increase in fossil fuel use. About 80% of the increasing electric power demand came from emerging economies, largely for rising air conditioning demands as the world gets hotter. In the U.S., the rapid growth of data centers for AI and cryptocurrency mining helped boost U.S. carbon dioxide emissions by 2.4%.
Earth’s energy imbalance: Other sources can disrupt the natural balance between the amount of sunlight that reaches Earth and the lesser amount radiated back to space. A recent study found that Earth’s energy uptake surged and temperatures rose quickly when a rare three-year La Niña in 2020-2022 shifted to El Niño in 2023-2024.
Declining polar ice, which efficiently reflects sunlight back into space, also affects the energy balance. As sea ice declines, it leaves dark ocean water that absorbs most of the sunlight that reaches it. In a spiraling feedback, warmer water melts sea ice, allowing more sunlight into the ocean, warming it faster; 2025 had the lowest winter peak of Arctic sea ice on record and the third-lowest minimum extent of Antarctic ice.
https://datawrapper.dwcdn.net/t0SSd/1
Air pollution: Sulfate aerosol pollution from coal combustion and burning heavy fuel oil in shipping has also been affecting Earth’s energy balance. It has been masking the full effects of human-caused greenhouse gases for years by reflecting sunlight back into space, creating a cooling effect. But sulfate aerosol pollution is also a serious health hazard, blamed for about 8 million human deaths per year from lung diseases.
Recent reductions in sulfate pollution – now 40% less than 20 years ago – have meant about a 0.2 F (0.13 C) increase in global temperatures. Much of the reduction was from China’s efforts to reduce its notoriously bad air pollution in recent years and international shipping rules in effect since 2020 that have reduced sulfur emissions from large ships by 85%.
Taking all factors together, humans are now warming the planet at a faster rate than at any point in human history: at about 0.5 F (0.27 C) per decade. That extra heat can fuel extreme weather, including flash floods, heat waves, extended droughts, wildfires and coastal flooding, affecting human lives and economies.
Predictions for 2026
Most climate models predict 2026 will be about as hot as 2025, depending on whether a Pacific El Niño develops, which forecasters give about a 60% chance of happening. The planet is already starting the year out warm, even if it doesn’t feel like that everywhere. While January was very cold in parts of the U.S., globally, Earth saw its fifth-warmest January on record, and much of the western U.S. saw one of its warmest winters on record.
Solar output will continue to decrease slowly in 2026. However, the International Monetary Fund projects strong global economic growth at about 3.3%, suggesting electricity demand will also continue to grow. The International Energy Agency expects global electricity demand to increase by 3.6% per year through at least 2030.
Even though global renewable energy use is growing quickly, it isn’t growing fast enough to meet rising demand, meaning more fossil fuel use in the coming years. More fossil fuels burned means more emissions and more warming, while the ability of the ocean and land to absorb carbon dioxide continues to decrease. As a result, the atmosphere and oceans heat up, increasing the risks of passing tipping points – glaciers disappear, Atlantic Ocean circulation shuts down, permafrost thaws, coral reefs die.
If greenhouse gas emissions continue at a high rate, humanity may look back at 2025 as one the coolest years globally in the rest of our lives.
Michael Wysession, Professor of Earth, Environmental, and Planetary Sciences, Washington University in St. Louis
This article is republished from The Conversation under a Creative Commons license. Read the original article.
Dive into “The Knowledge,” where curiosity meets clarity. This playlist, in collaboration with STMDailyNews.com, is designed for viewers who value historical accuracy and insightful learning. Our short videos, ranging from 30 seconds to a minute and a half, make complex subjects easy to grasp in no time. Covering everything from historical events to contemporary processes and entertainment, “The Knowledge” bridges the past with the present. In a world where information is abundant yet often misused, our series aims to guide you through the noise, preserving vital knowledge and truths that shape our lives today. Perfect for curious minds eager to discover the ‘why’ and ‘how’ of everything around us. Subscribe and join in as we explore the facts that matter. https://stmdailynews.com/the-knowledge/