The Earth
How the polar vortex and warm ocean intensified a major US winter storm
Last Updated on March 8, 2026 by Daily News Staff

How the polar vortex and warm ocean intensified a major US winter storm
Mathew Barlow, UMass Lowell and Judah Cohen, Massachusetts Institute of Technology (MIT)
A severe winter storm that brought crippling freezing rain, sleet and snow to a large part of the U.S. in late January 2026 left a mess in states from New Mexico to New England. Hundreds of thousands of people lost power across the South as ice pulled down tree branches and power lines, more than a foot of snow fell in parts of the Midwest and Northeast, and many states faced bitter cold that was expected to linger for days.
The sudden blast may have come as a shock to many Americans after a mostly mild start to winter, but that warmth may have partly contributed to the ferocity of the storm.
As atmospheric and climate scientists, we conduct research that aims to improve understanding of extreme weather, including what makes it more or less likely to occur and how climate change might or might not play a role.
To understand what Americans are experiencing with this winter blast, we need to look more than 20 miles above the surface of Earth, to the stratospheric polar vortex.
What creates a severe winter storm like this?
Multiple weather factors have to come together to produce such a large and severe storm.
Winter storms typically develop where there are sharp temperature contrasts near the surface and a southward dip in the jet stream, the narrow band of fast-moving air that steers weather systems. If there is a substantial source of moisture, the storms can produce heavy rain or snow.
In late January, a strong Arctic air mass from the north was creating the temperature contrast with warmer air from the south. Multiple disturbances within the jet stream were acting together to create favorable conditions for precipitation, and the storm system was able to pull moisture from the very warm Gulf of Mexico.
Where does the polar vortex come in?
The fastest winds of the jet stream occur just below the top of the troposphere, which is the lowest level of the atmosphere and ends about seven miles above Earth’s surface. Weather systems are capped at the top of the troposphere, because the atmosphere above it becomes very stable.
The stratosphere is the next layer up, from about seven miles to about 30 miles. While the stratosphere extends high above weather systems, it can still interact with them through atmospheric waves that move up and down in the atmosphere. These waves are similar to the waves in the jet stream that cause it to dip southward, but they move vertically instead of horizontally.
You’ve probably heard the term “polar vortex” used when an area of cold Arctic air moves far enough southward to influence the United States. That term describes air circulating around the pole, but it can refer to two different circulations, one in the troposphere and one in the stratosphere.
The Northern Hemisphere stratospheric polar vortex is a belt of fast-moving air circulating around the North Pole. It is like a second jet stream, high above the one you may be familiar with from weather graphics, and usually less wavy and closer to the pole.
Sometimes the stratospheric polar vortex can stretch southward over the United States. When that happens, it creates ideal conditions for the up-and-down movement of waves that connect the stratosphere with severe winter weather at the surface.
The forecast for the January storm showed a close overlap between the southward stretch of the stratospheric polar vortex and the jet stream over the U.S., indicating perfect conditions for cold and snow.
The biggest swings in the jet stream are associated with the most energy. Under the right conditions, that energy can bounce off the polar vortex back down into the troposphere, exaggerating the north-south swings of the jet stream across North America and making severe winter weather more likely.
This is what was happening in late January 2026 in the central and eastern U.S.
If the climate is warming, why are we still getting severe winter storms?
Earth is unequivocally warming as human activities release greenhouse gas emissions that trap heat in the atmosphere, and snow amounts are decreasing overall. But that does not mean severe winter weather will never happen again.
Some research suggests that even in a warming environment, cold events, while occurring less frequently, may still remain relatively severe in some locations.
One factor may be increasing disruptions to the stratospheric polar vortex, which appear to be linked to the rapid warming of the Arctic with climate change.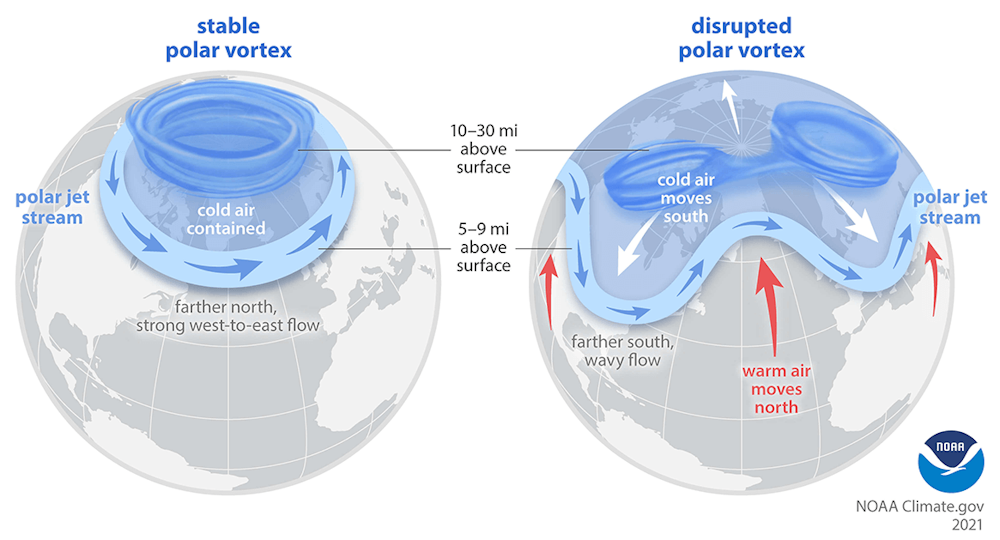
Additionally, a warmer ocean leads to more evaporation, and because a warmer atmosphere can hold more moisture, that means more moisture is available for storms. The process of moisture condensing into rain or snow produces energy for storms as well. However, warming can also reduce the strength of storms by reducing temperature contrasts.
The opposing effects make it complicated to assess the potential change to average storm strength. However, intense events do not necessarily change in the same way as average events. On balance, it appears that the most intense winter storms may be becoming more intense.
A warmer environment also increases the likelihood that precipitation that would have fallen as snow in previous winters may now be more likely to fall as sleet and freezing rain.
There are still many questions
Scientists are constantly improving the ability to predict and respond to these severe weather events, but there are many questions still to answer.
Much of the data and research in the field relies on a foundation of work by federal employees, including government labs like the National Center for Atmospheric Research, known as NCAR, which has been targeted by the Trump administration for funding cuts. These scientists help develop the crucial models, measuring instruments and data that scientists and forecasters everywhere depend on.
This article, originally published Jan. 24, 2026, has been updated with details from the weekend storm.
Mathew Barlow, Professor of Climate Science, UMass Lowell and Judah Cohen, Climate scientist, Massachusetts Institute of Technology (MIT)
This article is republished from The Conversation under a Creative Commons license. Read the original article.
The science section of our news blog STM Daily News provides readers with captivating and up-to-date information on the latest scientific discoveries, breakthroughs, and innovations across various fields. We offer engaging and accessible content, ensuring that readers with different levels of scientific knowledge can stay informed. Whether it’s exploring advancements in medicine, astronomy, technology, or environmental sciences, our science section strives to shed light on the intriguing world of scientific exploration and its profound impact on our daily lives. From thought-provoking articles to informative interviews with experts in the field, STM Daily News Science offers a harmonious blend of factual reporting, analysis, and exploration, making it a go-to source for science enthusiasts and curious minds alike. https://stmdailynews.com/category/science/
Discover more from Daily News
Subscribe to get the latest posts sent to your email.

Science
Saltwater flooding is a serious fire threat for EVs and other devices with lithium-ion batteries
Last Updated on March 15, 2026 by Daily News Staff
Xinyu Huang, University of South Carolina
Flooding from hurricanes Helene and Milton inflicted billions of dollars in damage across the Southeast in September and October 2024, pushing buildings off their foundations and undercutting roads and bridges. It also caused dozens of electric vehicles and other battery-powered objects, such as scooters and golf carts, to catch fire.
According to one tally, 11 electric cars and 48 lithium-ion batteries caught fire after exposure to salty floodwater from Helene. In some cases, these fires spread to homes.
When a lithium-ion battery pack bursts into flames, it releases toxic fumes, burns violently and is extremely hard to put out. Frequently, firefighters’ only option is to let it burn out by itself.
Particularly when these batteries are soaked in saltwater, they can become “ticking time bombs,” in the words of Florida State Fire Marshall Jimmy Patronis. That’s because the fire doesn’t always occur immediately when the battery is flooded. According to the National Highway Traffic Safety Administration, about 36 EVs flooded by Hurricane Ian in Florida in 2022 caught fire, including several that were being towed after the storm on flatbed trailers.
Many consumers are unaware of this risk, and lithium-ion batteries are widely used in EVs and hybrid cars, e-bikes and scooters, electric lawnmowers and cordless power tools.
I’m a mechanical engineer and am working to help solve battery safety issues for our increasingly electrified society. Here’s what all owners should know about water and the risk of battery fires: https://www.youtube.com/embed/gWkEGEbpqFc?wmode=transparent&start=10 Emergency responders handle EVs that were immersed in saltwater during Hurricane Ian in Florida in 2022, including some that ignited.
The threat of saltwater
The trigger for lithium-ion battery fires is a process called thermal runaway – a cascading sequence of heat-releasing reactions inside the battery cell.
Under normal operating conditions, the probability of a lithium-ion cell going into thermal runaway is less than 1 in 10 million. But it increases sharply if the cell is subjected to electrical, thermal or mechanical stress, such as short-circuiting, overheating or puncture.
Saltwater is a particular problem for batteries because salt dissolved in water is conductive, which means that electric current readily flows through it. Pure water is not very conductive, but the electrical conductivity of seawater can be more than a thousand times higher than that of fresh water.
All EV battery pack enclosures use gaskets to seal off their internal space from the elements outside. Typically, they have waterproof ratings of IP66 or IP67. While these ratings are high, they do not guarantee that a battery will be watertight when it is immersed for a long period of time – say, over 30 minutes.
Battery packs also have various ports to equalize pressure inside the battery and move electrical power in and out. These can be potential pathways for water to leak into the pack enclosure. Inadequate seal ratings and manufacturing defects can also enable water to find its way into the battery pack if it is immersed.
How water leads to fire
All batteries have two terminals: One is marked positive (+), and the other is marked negative (-). When the terminals are connected to a device that uses electricity to do work, such as a light bulb, chemical reactions occur inside the battery that cause electrons to flow from the negative to the positive terminal. This creates an electric current and releases the energy stored in the battery.
Electrons flow between a battery’s terminals because the chemical reactions inside the battery create different electrical potentials between the two terminals. This difference is also known as voltage. When saltwater comes into contact with metal battery terminals with different electrical potentials, the battery can short-circuit, inducing rapid corrosion and electric arcing, and generating excessive current and heat. The more conductive the liquid is that penetrates the battery pack, the higher the shorting current and rate of corrosion.
Rapid corrosion reactions within the battery pack produce hydrogen and oxygen, corroding away materials from metallic terminals on the positive side of the battery and depositing them onto the negative side. Even after the water drains away, these deposited materials can form solid shorting bridges that remain inside the battery pack, causing a delayed thermal runaway. A fire can start days after the battery is flooded.
Even a battery pack that is fully discharged isn’t necessarily safe during flooding. A lithium-ion cell, even at 0% state of charge, still has about a three-volt potential difference between its positive and negative terminals, so some current can flow between them. For a battery string with many cells in a series – a typical configuration in electric cars – residual voltage can still be high enough to drive these reactions.
Many scientists, including me and my colleagues, are working to understand the exact sequence of events that can occur in a battery pack after it is exposed to saltwater and lead to thermal runaway. We also are looking for ways to help reduce fire risks from flooded battery packs.
These could include finding better ways to seal the battery packs; using alternative, more corrosion-resistant materials for the battery terminals; and applying waterproof coatings to exposed terminals inside the battery pack.
What EV owners should know
Electric cars are still very safe to drive and own in most circumstances. However, during extreme situations like hurricanes and flooding, it is very important to keep EV battery packs from becoming submerged in water, particularly saltwater. The same is true for other products that contain lithium-ion batteries.
For EVs, this means evacuating cars out of the affected zone or parking them on high ground before flooding occurs. Smaller objects, like e-bikes and power tools, can be moved to upper floors of buildings or stored on high shelves.
If you own an EV that has been submerged in water for hours to days, particularly in saltwater, public safety experts recommend treating it as a fire hazard and placing it on open ground away from other valuable property. Do not attempt to charge or operate it. Contact the manufacturer for an inspection to assess battery damage.
Often, a flooded electric vehicle will need to be towed away for further inspection. However, since thermal runaway can occur well after submersion, the car should not be moved until it has been professionally assessed.
Xinyu Huang, Associate Professor of Mechanical Engineering, University of South Carolina
This article is republished from The Conversation under a Creative Commons license. Read the original article.
The science section of our news blog STM Daily News provides readers with captivating and up-to-date information on the latest scientific discoveries, breakthroughs, and innovations across various fields. We offer engaging and accessible content, ensuring that readers with different levels of scientific knowledge can stay informed. Whether it’s exploring advancements in medicine, astronomy, technology, or environmental sciences, our science section strives to shed light on the intriguing world of scientific exploration and its profound impact on our daily lives. From thought-provoking articles to informative interviews with experts in the field, STM Daily News Science offers a harmonious blend of factual reporting, analysis, and exploration, making it a go-to source for science enthusiasts and curious minds alike. https://stmdailynews.com/category/science/
Discover more from Daily News
Subscribe to get the latest posts sent to your email.
The Knowledge
2025 was hotter than it should have been – 5 influences and a dirty surprise offer clues to what’s ahead
The past three years recorded unprecedented global heat, with 2025 being particularly warm. Factors such as greenhouse gas emissions and a decline in solar activity influenced temperatures and extreme weather patterns.

Michael Wysession, Washington University in St. Louis
The past three years have been the world’s hottest on record by far, with 2025 almost tied with 2023 for second place. With that energy came extreme weather, from flash flooding to powerful hurricanes and severe droughts. Yet, by most indicators, the planet should have been cooler in 2025 than it was.
So, what happened, and what does that say about the year ahead?
As an earth and environmental scientist, I study influences that affect global temperatures year to year, such as El Niño, wildfires and solar cycles. Some make Earth hotter. Some make it cooler. And one particularly unhealthy influence has been quietly hiding a large amount of global warming – until now.
Factors that made 2025 cooler than 2024
The Earth’s climate is the result of many factors that change from year to year. Some that helped make 2025 cooler than 2024 include:
La Niña’s arrival: La Niña is part of the El Niño-Southern Oscillation, a natural climate pattern that fluctuates between warm El Niño conditions and cooler La Niña conditions. During El Niño, the Pacific Ocean heats up along the equator, influencing the atmosphere in ways that can cause intense storms, droughts and heat waves around the planet. La Niña does the opposite; it’s like putting an ice pack on the atmosphere.
Both 2023 and 2024 were El Niño years, but in 2025 conditions shifted to neutral and then to La Niña starting in September.
The solar cycle: The Sun reached its solar maximum near the end of 2024, the peak of its energy output in an approximately 11-year cycle, and began declining in 2025. So, while the sun’s output was still stronger than average in 2025, it was less than in 2024.
Fewer wildfires: Despite some destructive blazes, the world also saw fewer wildfires during 2025 than 2024, which put less carbon dioxide – a planet-warming greenhouse gas – into the atmosphere.
Despite those points, 2025 still ended up as the third-hottest year in over 175 years of record-keeping and likely one of the warmest in at least several thousand years. It was nearly as warm as 2023, at 2.6 degrees Fahrenheit (1.47 Celsius) above the 1850-1900 average, according to the European Union’s Copernicus Climate Change Service. It also had the second-highest average land temperature recorded, up 3.6 F (2 C) compared to preindustrial years, with more than 10% of the land experiencing record-high temperatures.
Factors that made 2025 warmer than expected
Several other factors made 2025 warmer than expected, and some are likely to continue to increase in 2026. They include:
Greenhouse gas emissions: The big driver of global warming is excess greenhouse gas emissions, largely from burning fossil fuels, and 2025 had plenty.
Greenhouse gases trap heat near Earth’s surface like a blanket, raising the temperature. They also linger in the atmosphere for years to centuries, meaning gases released today will continue to warm the planet well into the future. The levels of carbon dioxide, methane and nitrous oxide in the atmosphere all increased in 2025.

Rising energy demand drove an increase in fossil fuel use. About 80% of the increasing electric power demand came from emerging economies, largely for rising air conditioning demands as the world gets hotter. In the U.S., the rapid growth of data centers for AI and cryptocurrency mining helped boost U.S. carbon dioxide emissions by 2.4%.
Earth’s energy imbalance: Other sources can disrupt the natural balance between the amount of sunlight that reaches Earth and the lesser amount radiated back to space. A recent study found that Earth’s energy uptake surged and temperatures rose quickly when a rare three-year La Niña in 2020-2022 shifted to El Niño in 2023-2024.
Declining polar ice, which efficiently reflects sunlight back into space, also affects the energy balance. As sea ice declines, it leaves dark ocean water that absorbs most of the sunlight that reaches it. In a spiraling feedback, warmer water melts sea ice, allowing more sunlight into the ocean, warming it faster; 2025 had the lowest winter peak of Arctic sea ice on record and the third-lowest minimum extent of Antarctic ice.
https://datawrapper.dwcdn.net/t0SSd/1
Air pollution: Sulfate aerosol pollution from coal combustion and burning heavy fuel oil in shipping has also been affecting Earth’s energy balance. It has been masking the full effects of human-caused greenhouse gases for years by reflecting sunlight back into space, creating a cooling effect. But sulfate aerosol pollution is also a serious health hazard, blamed for about 8 million human deaths per year from lung diseases.
Recent reductions in sulfate pollution – now 40% less than 20 years ago – have meant about a 0.2 F (0.13 C) increase in global temperatures. Much of the reduction was from China’s efforts to reduce its notoriously bad air pollution in recent years and international shipping rules in effect since 2020 that have reduced sulfur emissions from large ships by 85%.
Taking all factors together, humans are now warming the planet at a faster rate than at any point in human history: at about 0.5 F (0.27 C) per decade. That extra heat can fuel extreme weather, including flash floods, heat waves, extended droughts, wildfires and coastal flooding, affecting human lives and economies.
Predictions for 2026
Most climate models predict 2026 will be about as hot as 2025, depending on whether a Pacific El Niño develops, which forecasters give about a 60% chance of happening. The planet is already starting the year out warm, even if it doesn’t feel like that everywhere. While January was very cold in parts of the U.S., globally, Earth saw its fifth-warmest January on record, and much of the western U.S. saw one of its warmest winters on record.
Solar output will continue to decrease slowly in 2026. However, the International Monetary Fund projects strong global economic growth at about 3.3%, suggesting electricity demand will also continue to grow. The International Energy Agency expects global electricity demand to increase by 3.6% per year through at least 2030.
Even though global renewable energy use is growing quickly, it isn’t growing fast enough to meet rising demand, meaning more fossil fuel use in the coming years. More fossil fuels burned means more emissions and more warming, while the ability of the ocean and land to absorb carbon dioxide continues to decrease. As a result, the atmosphere and oceans heat up, increasing the risks of passing tipping points – glaciers disappear, Atlantic Ocean circulation shuts down, permafrost thaws, coral reefs die.
If greenhouse gas emissions continue at a high rate, humanity may look back at 2025 as one the coolest years globally in the rest of our lives.
Michael Wysession, Professor of Earth, Environmental, and Planetary Sciences, Washington University in St. Louis
This article is republished from The Conversation under a Creative Commons license. Read the original article.
Dive into “The Knowledge,” where curiosity meets clarity. This playlist, in collaboration with STMDailyNews.com, is designed for viewers who value historical accuracy and insightful learning. Our short videos, ranging from 30 seconds to a minute and a half, make complex subjects easy to grasp in no time. Covering everything from historical events to contemporary processes and entertainment, “The Knowledge” bridges the past with the present. In a world where information is abundant yet often misused, our series aims to guide you through the noise, preserving vital knowledge and truths that shape our lives today. Perfect for curious minds eager to discover the ‘why’ and ‘how’ of everything around us. Subscribe and join in as we explore the facts that matter. https://stmdailynews.com/the-knowledge/
Author
Discover more from Daily News
Subscribe to get the latest posts sent to your email.
The Knowledge
What Is a Gustnado?
A gustnado may look like a tornado, but it’s a different weather phenomenon. Learn what a gustnado is, how it forms, and why it’s usually weaker.
Last Updated on December 18, 2025 by Daily News Staff
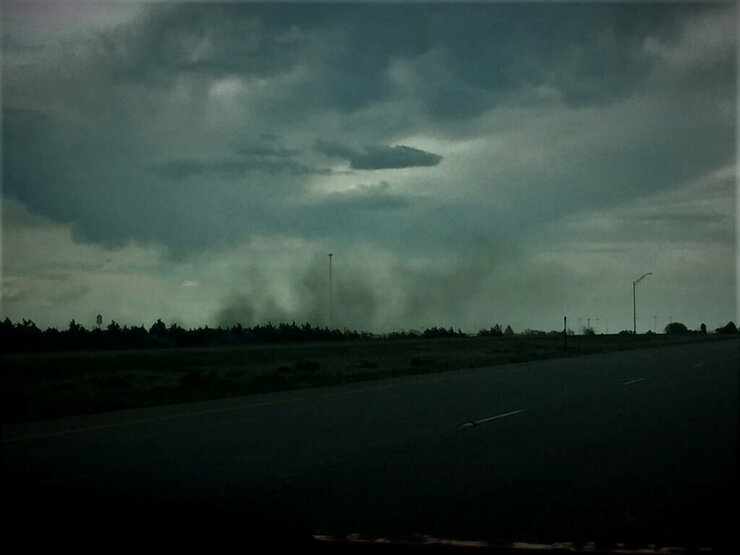
A gustnado east of Limon, Colorado. Image Credit: Jessica Kortekaas
Severe weather can produce dramatic sights—but not every spinning column of air is a tornado.
A [gustnado](chatgpt://generic-entity?number=0) is a brief, ground-level swirl of rotating air that forms along a thunderstorm’s gust front. Gustnadoes often appear suddenly, kicking up dust or debris, which can make them look more dangerous than they actually are.
Unlike tornadoes, gustnadoes do not connect to a storm’s rotating updraft. Because of this, they are usually weaker, short-lived, and difficult to detect on weather radar.
Gustnadoes typically last only seconds to a few minutes and are most commonly spotted in dry regions, where loose soil makes their rotation visible.
The takeaway: If it’s spinning near the ground ahead of a storm, it may look intense—but it’s not always a tornado.
Learn the differences between tornadoes, dust devils, and other rotating weather phenomena in our STM Daily News Knowledge Series.
Author
Discover more from Daily News
Subscribe to get the latest posts sent to your email.